\n
## Diagram: Microscopic Observations
### Overview
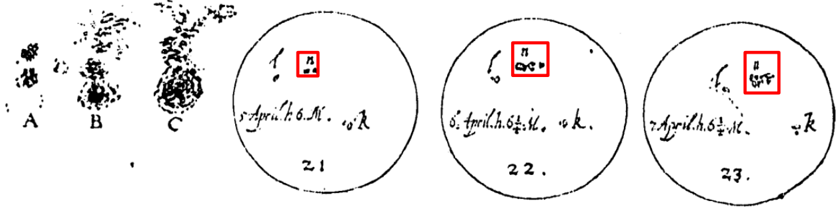
The image presents a series of microscopic observations, likely of biological samples, arranged in a row. The observations are labeled A, B, C, 21, 22, and 23. Each observation, except A, B, and C, is contained within a circular frame. Within the circular frames, there are smaller, rectangular boxes containing the number "n" and a symbol resembling a small square. There is also handwritten text below each circular frame.
### Components/Axes
The image lacks traditional axes or a legend. The components are:
* **A, B, C:** Dense clusters of dots, representing microscopic structures.
* **21, 22, 23:** Circular frames containing dot clusters and a labeled box.
* **"n" Boxes:** Small rectangular boxes within the circles, containing the letter "n" and a square symbol.
* **Handwritten Text:** Text below each circular frame. The text appears to be in German.
### Content Details
Let's transcribe the handwritten text and attempt a translation:
* **21:** "5. April h. 6 ¼. v.k." - Translation: "5th April hour 6:15 a.m. v.k." (v.k. likely initials of the observer)
* **22:** "6. April h. 6 ¼. v.k." - Translation: "6th April hour 6:15 a.m. v.k."
* **23:** "7. April h. 6 ¼. v.k." - Translation: "7th April hour 6:15 a.m. v.k."
The dot clusters within the circles appear to be somewhat dispersed in 21, more concentrated in 22, and even more concentrated in 23. The "n" boxes are positioned in the top-right corner of each circle.
### Key Observations
* The observations are time-series data, spanning three days (April 5th, 6th, and 7th) at the same time (6:15 a.m.).
* The density of the dot clusters appears to increase over time (from 21 to 23).
* The "n" boxes suggest a count or measurement related to the observed structures.
* The handwritten notes indicate the date, time, and the initials of the observer.
### Interpretation
This diagram likely documents a biological process occurring over time. The increasing density of the dot clusters from observation 21 to 23 suggests a growth, aggregation, or concentration of the observed material. The "n" boxes likely represent a quantitative measurement of the observed structures, perhaps a cell count or a measure of density. The consistent time of observation (6:15 a.m.) suggests a controlled experiment or a regular monitoring schedule. The German text indicates the origin of the data and the observer. Without further context, it's difficult to determine the exact nature of the biological process being observed, but the data strongly suggests a dynamic change occurring over the three-day period. The initial observations A, B, and C may be control samples or initial conditions for the time-series observations 21, 22, and 23. The difference in presentation (no circle, no time stamp) suggests they are qualitatively different.