## Line Chart: Surprisal vs. Training Steps
### Overview
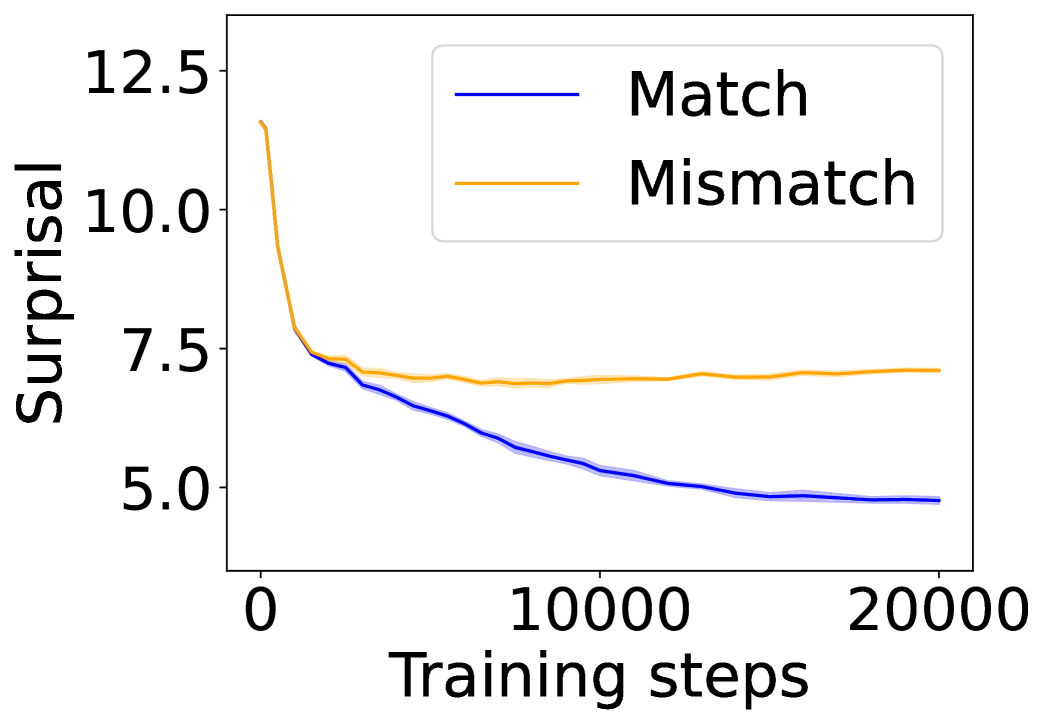
The image is a line chart comparing the surprisal values for "Match" and "Mismatch" scenarios over 20,000 training steps. The chart shows how surprisal changes as the model trains.
### Components/Axes
* **X-axis:** "Training steps" ranging from 0 to 20000, with a step of 5000.
* **Y-axis:** "Surprisal" ranging from 5.0 to 12.5, with a step of 2.5.
* **Legend:** Located in the top-right corner, it identifies the two data series:
* Blue line: "Match"
* Orange line: "Mismatch"
### Detailed Analysis
* **Match (Blue Line):**
* Trend: The "Match" line starts at a surprisal value of approximately 7.5 at 0 training steps and generally decreases as training steps increase.
* Data Points:
* At 0 training steps, surprisal is approximately 7.5.
* At 5000 training steps, surprisal is approximately 6.25.
* At 10000 training steps, surprisal is approximately 5.5.
* At 15000 training steps, surprisal is approximately 5.0.
* At 20000 training steps, surprisal is approximately 4.75.
* **Mismatch (Orange Line):**
* Trend: The "Mismatch" line starts at a surprisal value of approximately 12.0 at 0 training steps and rapidly decreases initially, then plateaus and remains relatively constant.
* Data Points:
* At 0 training steps, surprisal is approximately 12.0.
* At 5000 training steps, surprisal is approximately 7.25.
* At 10000 training steps, surprisal is approximately 7.25.
* At 15000 training steps, surprisal is approximately 7.25.
* At 20000 training steps, surprisal is approximately 7.25.
### Key Observations
* The "Mismatch" surprisal starts much higher than the "Match" surprisal.
* Both "Match" and "Mismatch" surprisal decrease significantly in the initial training steps.
* The "Match" surprisal continues to decrease gradually throughout the training, while the "Mismatch" surprisal plateaus after the initial drop.
* There is a shaded region around each line, indicating a confidence interval or standard deviation.
### Interpretation
The chart illustrates how the model's "surprisal" (a measure of unexpectedness or error) changes during training for "Match" and "Mismatch" scenarios. The initial high surprisal for "Mismatch" suggests that the model initially struggles more with mismatched data. As training progresses, the model learns to handle both scenarios, reducing surprisal. The "Match" scenario shows a continuous improvement, while the "Mismatch" scenario plateaus, suggesting that the model may have reached a limit in its ability to handle mismatched data or that further training would be needed to improve performance on "Mismatch" cases. The shaded regions indicate the variability in the surprisal values across multiple runs or data samples.