## Line Chart: Surprisal vs. Training Steps
### Overview
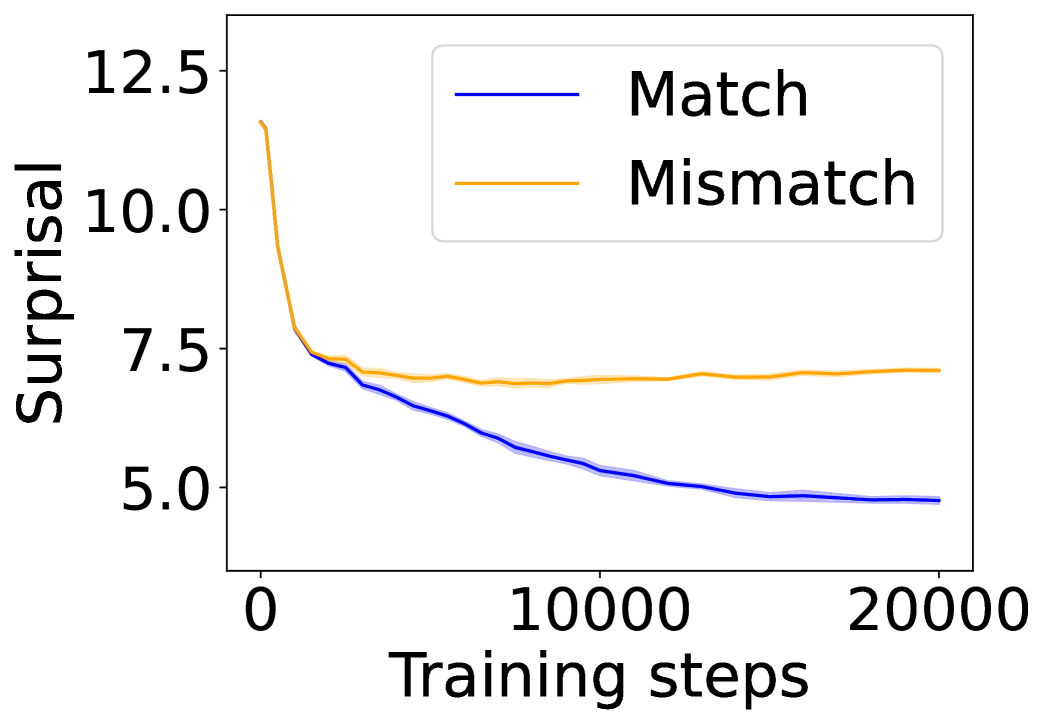
The image displays a line chart plotting "Surprisal" on the vertical y-axis against "Training steps" on the horizontal x-axis. It compares two conditions or data series labeled "Match" and "Mismatch." The chart illustrates how the surprisal metric changes for each condition as the number of training steps increases from 0 to 20,000.
### Components/Axes
* **Y-Axis (Vertical):**
* **Label:** "Surprisal"
* **Scale:** Linear scale.
* **Tick Markers:** 5.0, 7.5, 10.0, 12.5.
* **X-Axis (Horizontal):**
* **Label:** "Training steps"
* **Scale:** Linear scale.
* **Tick Markers:** 0, 10000, 20000.
* **Legend:**
* **Position:** Top-right corner of the plot area.
* **Series 1:** "Match" - represented by a solid blue line.
* **Series 2:** "Mismatch" - represented by a solid orange line.
### Detailed Analysis
**Trend Verification & Data Point Extraction:**
1. **"Match" (Blue Line):**
* **Visual Trend:** The line shows a consistent, monotonic downward slope across the entire range of training steps. It starts at a high value and decreases steadily, with the rate of decrease slowing slightly in the later steps.
* **Approximate Data Points:**
* Step 0: ~11.5
* Step ~2500: ~7.5 (intersects with the orange line)
* Step 10000: ~5.5
* Step 20000: ~4.8
2. **"Mismatch" (Orange Line):**
* **Visual Trend:** The line exhibits a very sharp initial decrease, followed by a pronounced plateau. After the initial drop, it remains relatively flat with minor fluctuations for the remainder of the training steps.
* **Approximate Data Points:**
* Step 0: ~11.5 (similar starting point to the blue line)
* Step ~1000: ~7.5 (sharp drop)
* Step ~2500: ~7.5 (intersects with the blue line)
* Step 10000: ~7.0
* Step 20000: ~7.2
**Spatial Grounding:** The two lines originate from nearly the same point on the y-axis at step 0. They cross at approximately step 2500, where the blue "Match" line descends below the orange "Mismatch" line and remains below it for all subsequent steps.
### Key Observations
1. **Diverging Paths:** While both conditions start with similar high surprisal, their trajectories diverge significantly after the initial training phase (~2500 steps).
2. **Plateau vs. Continuous Improvement:** The "Mismatch" condition reaches a performance plateau very early (around step 1000-2500) and shows no further improvement. In contrast, the "Match" condition continues to improve (lower surprisal) throughout the entire 20,000 training steps.
3. **Final Performance Gap:** By the end of the plotted training (20,000 steps), there is a substantial gap in performance. The "Match" condition achieves a surprisal value of approximately 4.8, while the "Mismatch" condition is stuck at approximately 7.2.
### Interpretation
This chart likely visualizes the learning dynamics of a machine learning model under two different training regimes or data conditions. "Surprisal" is a common metric in information theory and language modeling, often inversely related to model confidence or prediction accuracy (lower surprisal is better).
* **What the data suggests:** The "Match" condition represents a scenario where the training data or objective is well-aligned with the evaluation task, allowing the model to continuously learn and reduce its prediction error (surprisal) over time. The "Mismatch" condition represents a misaligned scenario where the model quickly learns the superficial or easily accessible patterns in the data but hits a fundamental limit, unable to generalize further or learn the deeper structures required to reduce surprisal on the target task.
* **How elements relate:** The x-axis (Training steps) is the independent variable representing effort or exposure. The y-axis (Surprisal) is the dependent variable representing performance. The two lines show how the relationship between effort and performance is fundamentally different based on the alignment condition ("Match" vs. "Mismatch").
* **Notable anomaly/insight:** The most critical insight is the early plateau of the "Mismatch" line. It indicates that simply increasing training duration is futile for that condition; the problem is not a lack of training but a fundamental mismatch in the learning setup. The continued descent of the "Match" line suggests that with proper alignment, the model's capacity for improvement has not yet been exhausted even at 20,000 steps.