## Line Chart: Success Rate vs. Problem Size by Difficulty
### Overview
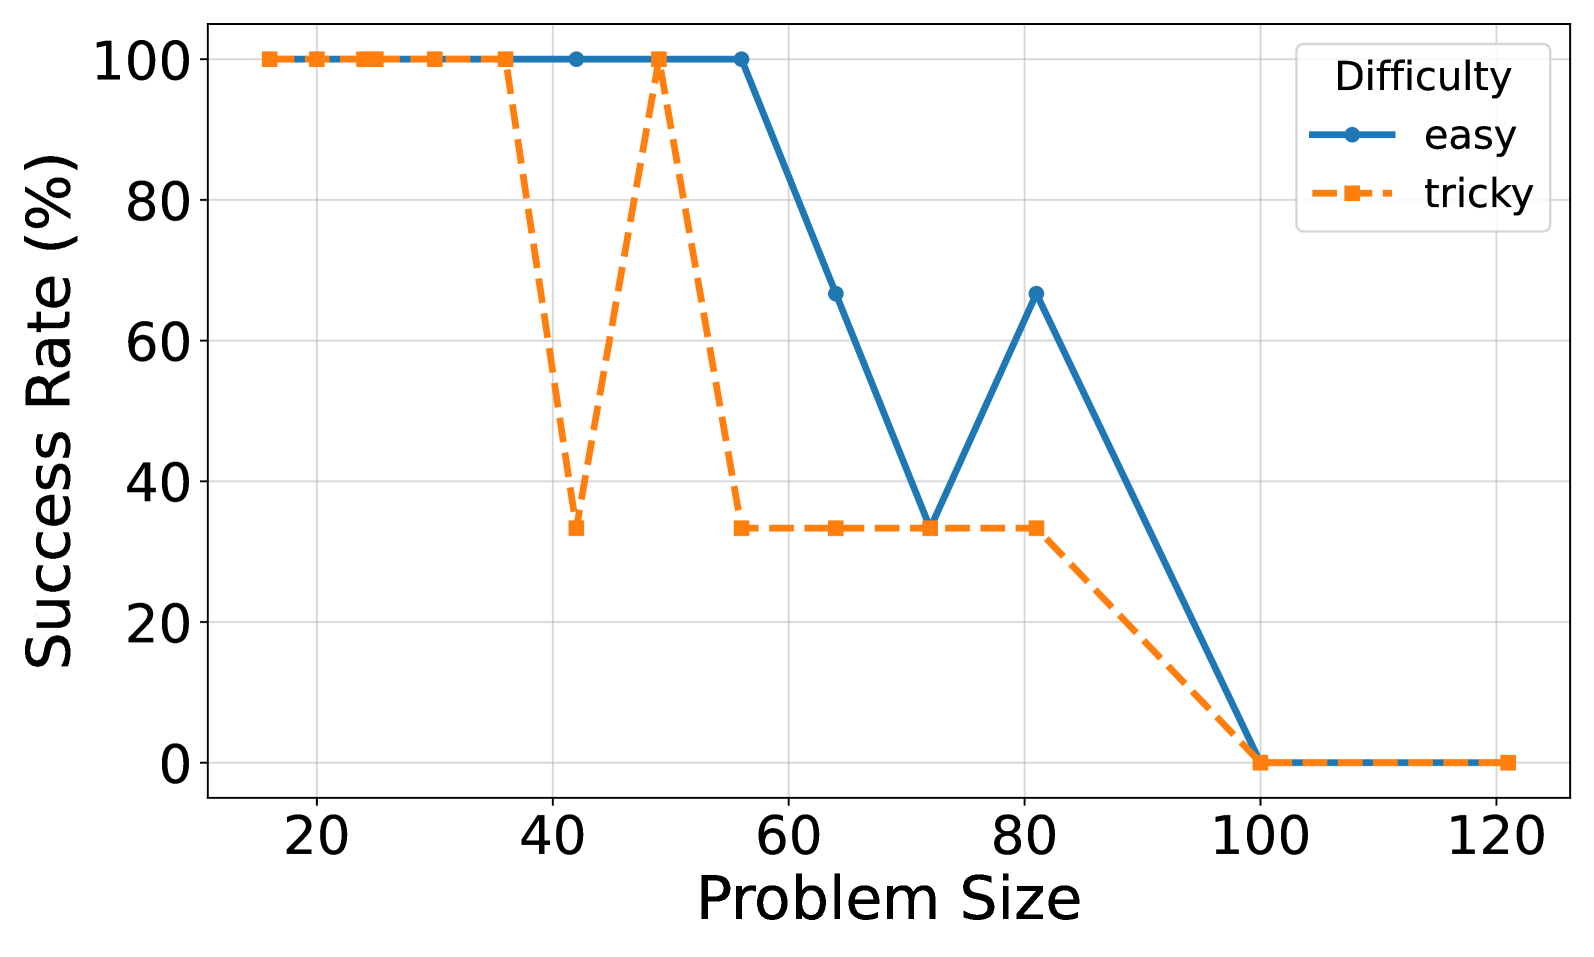
The image is a line chart comparing the success rate of solving problems of varying sizes, categorized by difficulty (easy and tricky). The x-axis represents the problem size, and the y-axis represents the success rate in percentage. The chart displays two lines, one for "easy" problems (solid blue) and one for "tricky" problems (dashed orange).
### Components/Axes
* **Title:** There is no explicit title on the chart.
* **X-axis:** "Problem Size", with tick marks at 20, 40, 60, 80, 100, and 120.
* **Y-axis:** "Success Rate (%)", with tick marks at 0, 20, 40, 60, 80, and 100.
* **Legend:** Located in the top-right corner, labeled "Difficulty".
* "easy": Represented by a solid blue line with circular markers.
* "tricky": Represented by a dashed orange line with square markers.
### Detailed Analysis
**Easy Problems (Solid Blue Line):**
* Trend: The success rate for easy problems remains at 100% until a problem size of approximately 60. It then decreases, rises again, and then decreases to 0% at a problem size of 100.
* Data Points:
* Problem Size 20-60: Success Rate 100%
* Problem Size 60: Success Rate ~67%
* Problem Size 80: Success Rate ~67%
* Problem Size 100-120: Success Rate 0%
**Tricky Problems (Dashed Orange Line):**
* Trend: The success rate for tricky problems remains at 100% until a problem size of approximately 40. It then fluctuates significantly before decreasing to 0% at a problem size of 100.
* Data Points:
* Problem Size 20-40: Success Rate 100%
* Problem Size 40: Success Rate ~33%
* Problem Size 60: Success Rate ~33%
* Problem Size 80: Success Rate ~33%
* Problem Size 100-120: Success Rate 0%
### Key Observations
* For smaller problem sizes (20-40), both "easy" and "tricky" problems have a 100% success rate.
* The success rate for "tricky" problems drops sharply at a problem size of 40, while the success rate for "easy" problems remains high until a problem size of 60.
* Both "easy" and "tricky" problems have a 0% success rate for problem sizes of 100 and above.
* The "easy" problem success rate peaks at problem size 80.
### Interpretation
The chart suggests that problem size significantly impacts the success rate, especially for "tricky" problems. "Easy" problems are solvable until a larger problem size is reached. Both types of problems become unsolvable as the problem size increases beyond a certain threshold (around 100). The fluctuation in the "tricky" problem success rate between problem sizes 40 and 80 indicates that other factors besides size may influence the difficulty of these problems. The data demonstrates that problem difficulty is not solely determined by size, as "tricky" problems show a more volatile success rate compared to "easy" problems.