\n
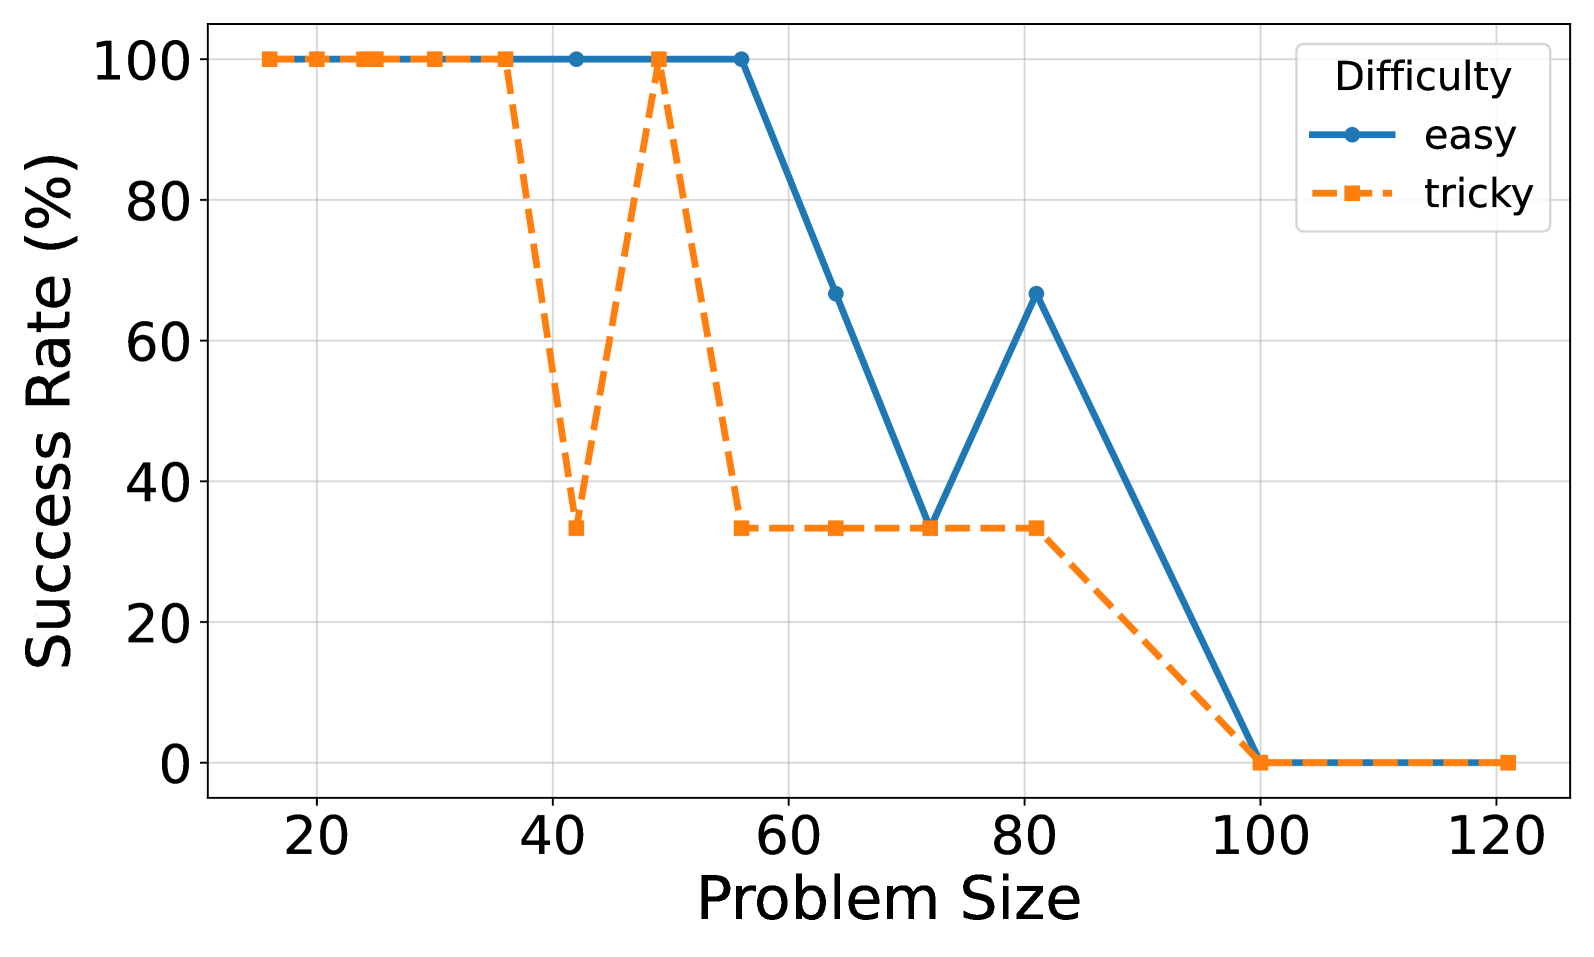
## Line Chart: Success Rate vs. Problem Size by Difficulty
### Overview
This is a line chart comparing the success rate (in percentage) of solving problems of varying sizes, categorized by two difficulty levels: "easy" and "tricky". The chart illustrates how performance degrades as problem complexity increases, with distinct patterns for each difficulty category.
### Components/Axes
* **Chart Type:** Line chart with markers.
* **X-Axis (Horizontal):** Labeled **"Problem Size"**. The axis has major tick marks and labels at intervals of 20, specifically at: 20, 40, 60, 80, 100, 120.
* **Y-Axis (Vertical):** Labeled **"Success Rate (%)"**. The axis ranges from 0 to 100, with major tick marks and labels at intervals of 20: 0, 20, 40, 60, 80, 100.
* **Legend:** Located in the **top-right corner** of the chart area. It is titled **"Difficulty"** and contains two entries:
* **"easy"**: Represented by a **solid blue line** with circular markers.
* **"tricky"**: Represented by a **dashed orange line** with square markers.
* **Grid:** A light gray grid is present in the background, aligned with the major ticks of both axes.
### Detailed Analysis
Data points are approximate, derived from visual inspection of the chart.
**1. "easy" Difficulty (Solid Blue Line with Circles):**
* **Trend:** Maintains a perfect success rate for smaller problem sizes, then experiences a sharp decline with a brief partial recovery before ultimately failing completely.
* **Data Points:**
* Problem Size ~20: Success Rate = **100%**
* Problem Size ~40: Success Rate = **100%**
* Problem Size ~60: Success Rate = **100%**
* Problem Size ~70: Success Rate ≈ **35%** (Sharp drop)
* Problem Size ~80: Success Rate ≈ **65%** (Partial recovery)
* Problem Size ~100: Success Rate = **0%**
* Problem Size ~120: Success Rate = **0%**
**2. "tricky" Difficulty (Dashed Orange Line with Squares):**
* **Trend:** Shows high volatility at mid-range problem sizes, with a sharp drop, a full recovery, and a plateau before a final decline to zero.
* **Data Points:**
* Problem Size ~20: Success Rate = **100%**
* Problem Size ~40: Success Rate = **100%**
* Problem Size ~40 (second point, slightly right): Success Rate ≈ **35%** (Sharp drop)
* Problem Size ~50: Success Rate = **100%** (Full recovery)
* Problem Size ~60: Success Rate ≈ **35%**
* Problem Size ~70: Success Rate ≈ **35%**
* Problem Size ~80: Success Rate ≈ **35%** (Plateau)
* Problem Size ~100: Success Rate = **0%**
* Problem Size ~120: Success Rate = **0%**
### Key Observations
1. **Performance Cliff:** Both difficulty levels show a complete failure (0% success) for problem sizes of 100 and above.
2. **Volatility in "tricky":** The "tricky" series exhibits a dramatic V-shaped dip and recovery between problem sizes 40 and 50, which is not present in the "easy" series.
3. **Delayed Decline for "easy":** The "easy" problems maintain a 100% success rate up to a larger problem size (~60) compared to the first drop in "tricky" problems (~40).
4. **Partial Recovery:** Only the "easy" series shows a significant partial recovery (from ~35% to ~65%) after its initial major drop.
5. **Convergent Failure:** Despite different paths, both series converge to the same 0% success rate at the largest problem sizes.
### Interpretation
The data suggests a non-linear relationship between problem size and solvability, heavily influenced by problem difficulty.
* **System Capacity Limit:** The universal drop to 0% at problem size 100 indicates a fundamental system or algorithmic limit. Beyond this threshold, the method being tested fails completely regardless of difficulty.
* **Difficulty Manifests as Instability:** The "tricky" category's volatile performance (the sharp drop and recovery) implies that certain mid-sized problems (around size 40-50) possess specific characteristics that cause catastrophic failure, which are not present in slightly smaller or larger "tricky" problems. This could point to sensitivity to particular problem structures or edge cases.
* **Robustness of "easy" Problems:** The "easy" category demonstrates greater robustness, sustaining perfect performance for larger sizes and showing a capacity for partial recovery after failure. This suggests the underlying method handles "easy" problem structures more predictably until a critical size is reached.
* **Practical Implication:** For applications using this method, problem size is a critical constraint. For "tricky" problems, sizes near 40 and beyond 80 are high-risk. For "easy" problems, sizes beyond 60 require caution, and sizes beyond 80 are likely to fail. The chart provides a clear visual guide for setting operational limits based on problem difficulty.