\n
## Scatter Plot: Confidence vs. Target Length for Logical Fallacies
### Overview
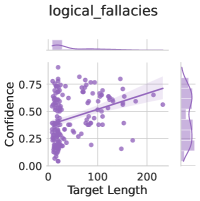
The image presents a scatter plot visualizing the relationship between "Target Length" and "Confidence" related to "logical_fallacies". The plot displays a positive correlation, with a regression line indicating a tendency for confidence to increase with target length. Marginal distributions are shown at the top and right sides of the plot.
### Components/Axes
* **Title:** "logical\_fallacies" (top-center)
* **X-axis:** "Target Length" (bottom-center), ranging from approximately 0 to 220.
* **Y-axis:** "Confidence" (left-center), ranging from 0.00 to 0.75.
* **Data Points:** Purple circles representing individual data points.
* **Regression Line:** A solid purple line representing the trend of the data.
* **Confidence Interval:** A shaded purple area around the regression line, indicating the uncertainty in the trend.
* **Top Marginal Distribution:** A density plot showing the distribution of "Target Length".
* **Right Marginal Distribution:** A density plot showing the distribution of "Confidence".
### Detailed Analysis
The scatter plot shows a generally upward trend. As "Target Length" increases, "Confidence" tends to increase as well.
* **Data Point Distribution:** The data points are clustered around the x-axis for low "Target Length" values (0-50), with "Confidence" values generally below 0.5. As "Target Length" increases beyond 50, the data points become more dispersed, with "Confidence" values reaching up to approximately 0.75.
* **Regression Line Trend:** The regression line slopes upward, indicating a positive correlation.
* **Regression Line Equation (approximate):** While the exact equation isn't provided, the line appears to start around (0, 0.2) and ends around (220, 0.6).
* **Top Marginal Distribution:** The distribution of "Target Length" is skewed to the right, with a peak around 20-50.
* **Right Marginal Distribution:** The distribution of "Confidence" is roughly symmetrical, with a peak around 0.4-0.5.
### Key Observations
* The positive correlation between "Target Length" and "Confidence" suggests that longer targets are associated with higher confidence levels.
* The spread of data points indicates that the relationship is not perfectly linear, and there is considerable variability in confidence for a given target length.
* The marginal distributions provide insights into the overall distributions of "Target Length" and "Confidence".
### Interpretation
This data suggests that the confidence in identifying or assessing "logical fallacies" increases as the length of the "target" (presumably the text or argument being analyzed) increases. This could be due to several factors: longer texts may provide more evidence to support or refute a fallacy, or longer texts may simply be easier to analyze. The confidence interval around the regression line indicates that the relationship is not strong, and there is considerable uncertainty in the prediction of confidence based on target length. The right-skewed distribution of target length suggests that most targets are relatively short, while the distribution of confidence is centered around a moderate level. This could indicate that the model or system being evaluated is more confident with shorter targets, or that shorter targets are easier to assess. The marginal distributions provide additional context for understanding the overall patterns in the data.