\n
## Charts: Waveform Analysis - Sound Event Detection
### Overview
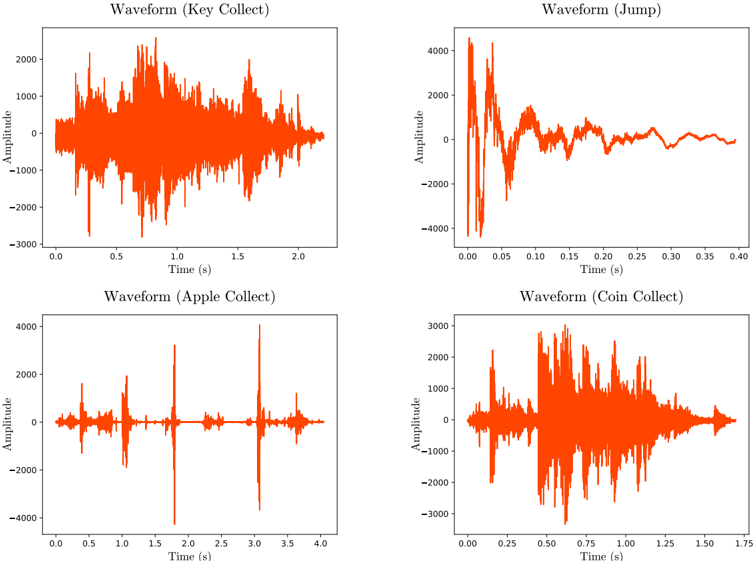
The image presents four separate waveform plots, each representing the amplitude of a sound signal over time. Each plot is labeled with the type of sound event it depicts: "Key Collect", "Jump", "Apple Collect", and "Coin Collect". The plots are arranged in a 2x2 grid. The y-axis represents Amplitude, and the x-axis represents Time (in seconds).
### Components/Axes
* **X-axis:** Time (s) - Ranges vary per plot.
* **Y-axis:** Amplitude - Ranges vary per plot, approximately from -4000 to 4000.
* **Titles:** Each plot has a title indicating the sound event: "Waveform (Key Collect)", "Waveform (Jump)", "Waveform (Apple Collect)", "Waveform (Coin Collect)".
* **Data Series:** Each plot contains a single orange line representing the waveform.
### Detailed Analysis or Content Details
**1. Waveform (Key Collect):**
* **Time Range:** 0.0 to 2.2 seconds.
* **Trend:** The waveform is highly variable, exhibiting numerous peaks and troughs. It appears to be a relatively noisy signal with no clear repeating pattern.
* **Amplitude:** Fluctuates rapidly between approximately -3000 and 3000.
* **Notable Points:** Multiple peaks around 0.2s, 0.7s, 1.3s, 1.8s, with amplitudes around 2000-3000. Multiple troughs around 0.5s, 1.0s, 1.6s, 2.0s, with amplitudes around -2000 to -3000.
**2. Waveform (Jump):**
* **Time Range:** 0.0 to 0.4 seconds.
* **Trend:** The waveform starts with a large positive spike, followed by a rapid decay and then smaller oscillations.
* **Amplitude:** Initial spike reaches approximately 4000, then decays to around 1000-2000.
* **Notable Points:** A large peak at approximately 0.02 seconds with an amplitude of around 4000. The signal then quickly drops to around 1000-2000 and oscillates around that level.
**3. Waveform (Apple Collect):**
* **Time Range:** 0.0 to 4.2 seconds.
* **Trend:** The waveform consists of several distinct, relatively sharp peaks separated by periods of lower amplitude. The peaks are somewhat periodic.
* **Amplitude:** Peaks reach approximately 3000-4000, troughs reach approximately -4000.
* **Notable Points:** Peaks are observed around 0.3s, 1.0s, 1.8s, 2.6s, 3.4s, with amplitudes around 3000. Troughs are observed between the peaks.
**4. Waveform (Coin Collect):**
* **Time Range:** 0.0 to 1.75 seconds.
* **Trend:** The waveform exhibits a series of closely spaced, high-frequency oscillations, followed by a more gradual decay.
* **Amplitude:** Oscillations range from approximately -3000 to 3000.
* **Notable Points:** A dense series of peaks and troughs within the first 0.75 seconds. The amplitude then decreases.
### Key Observations
* The "Jump" waveform has a very distinct initial spike, unlike the others.
* The "Apple Collect" waveform shows a more periodic pattern of peaks than the "Key Collect" waveform.
* The "Coin Collect" waveform has the highest frequency of oscillations.
* The "Key Collect" waveform appears to be the most chaotic and least structured.
### Interpretation
These waveforms likely represent audio recordings of the corresponding sound events. The differences in the waveforms reflect the distinct acoustic characteristics of each event. The "Jump" waveform's sharp initial spike suggests a sudden impact or change in sound pressure. The "Apple Collect" waveform's periodic peaks could be related to the repetitive nature of collecting apples (e.g., the sound of each apple being picked up). The "Coin Collect" waveform's high-frequency oscillations are characteristic of metallic impacts. The "Key Collect" waveform's complexity suggests a more varied and less predictable sound.
These waveforms could be used for sound event detection or classification tasks. Analyzing the features of these waveforms (e.g., peak amplitude, frequency content, temporal patterns) could allow a machine learning model to identify and categorize these sounds automatically. The differences in the waveforms suggest that these events are readily distinguishable based on their acoustic properties.