\n
## Scatter Plot: Energy Consumption vs. Model Size Over Time
### Overview
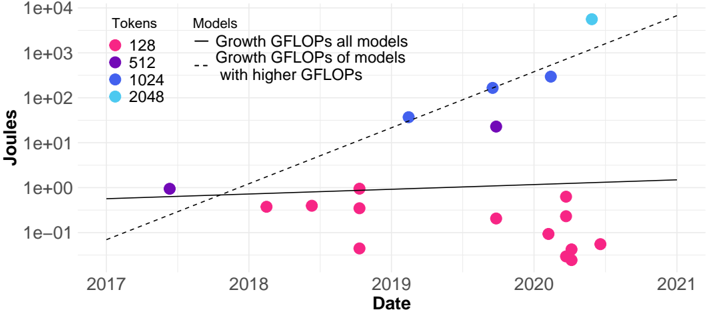
This image presents a scatter plot illustrating the relationship between energy consumption (in Joules) and time (Date) for different model sizes (measured in Tokens). Two trend lines are overlaid to show the growth of GFLOPs for all models and for models with higher GFLOPs. The data points are color-coded based on the number of tokens.
### Components/Axes
* **X-axis:** Date, ranging from approximately 2017 to 2021.
* **Y-axis:** Joules, displayed on a logarithmic scale from 1e-01 to 1e+04.
* **Legend:** Located in the top-right corner, defining the color-coding for the number of tokens:
* Pink: 128 Tokens
* Purple: 512 Tokens
* Blue: 1024 Tokens
* Cyan: 2048 Tokens
* **Lines:**
* Solid Black Line: Growth GFLOPs all models
* Dashed Gray Line: Growth GFLOPs of models with higher GFLOPs
### Detailed Analysis
The plot contains scattered data points representing energy consumption for different models at various dates. The solid black line represents the overall trend of GFLOPs growth for all models, while the dashed gray line represents the trend for models with higher GFLOPs.
**Data Point Analysis (Approximate Values):**
* **128 Tokens (Pink):**
* 2017: ~0.03 Joules
* 2018: ~0.05 Joules
* 2019: ~0.1 Joules
* 2020: ~0.08 Joules (with significant variation between ~0.02 and ~0.2 Joules)
* **512 Tokens (Purple):**
* 2017: ~0.5 Joules
* 2018: ~0.7 Joules
* 2019: ~1.5 Joules
* 2020: ~1.2 Joules (with variation between ~0.5 and ~2 Joules)
* **1024 Tokens (Blue):**
* 2019: ~2 Joules
* 2020: ~3 Joules
* **2048 Tokens (Cyan):**
* 2020: ~10 Joules
**Trend Lines:**
* **Solid Black Line (Growth GFLOPs all models):** The line is relatively flat, indicating a slow and steady growth in GFLOPs for all models. It starts at approximately 0.1 Joules in 2017 and reaches approximately 1 Joule in 2021.
* **Dashed Gray Line (Growth GFLOPs of models with higher GFLOPs):** This line slopes upward more steeply than the solid black line, indicating a faster growth in GFLOPs for models with higher GFLOPs. It starts at approximately 0.05 Joules in 2017 and reaches approximately 5 Joules in 2021.
### Key Observations
* Energy consumption generally increases with the number of tokens.
* The growth in energy consumption for models with higher GFLOPs is significantly faster than for all models combined.
* There is considerable variation in energy consumption for models with 128 and 512 tokens in 2020.
* The logarithmic scale on the Y-axis emphasizes the exponential growth in energy consumption for larger models.
### Interpretation
The data suggests that as models grow in size (number of tokens), their energy consumption increases. The steeper growth curve for models with higher GFLOPs indicates that more powerful models require significantly more energy. This highlights the growing energy demands of increasingly complex AI models. The variation in energy consumption for smaller models in 2020 could be due to differences in model architecture, training methods, or hardware used. The logarithmic scale is crucial for visualizing the large differences in energy consumption between smaller and larger models. The plot demonstrates a clear trade-off between model performance (GFLOPs) and energy efficiency. The divergence of the two trend lines suggests that the energy cost of increasing model complexity is accelerating. This has implications for the sustainability of AI development and the need for more energy-efficient algorithms and hardware.