\n
## 3D Diagram: Triangular Pyramid
### Overview
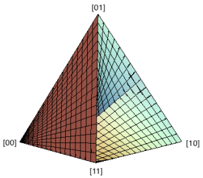
The image depicts a triangular pyramid rendered in a 3D perspective. The pyramid's surface is divided into three distinct colored regions: reddish-brown, light blue, and pale yellow. The coordinate axes are labeled, indicating a three-dimensional space. The diagram appears to be a visual representation of a mathematical or geometric concept, potentially related to a simplex or a constraint region.
### Components/Axes
The diagram features the following components:
* **Pyramid Structure:** A triangular pyramid with a triangular base and three sloping sides.
* **Coordinate Axes:** Three axes are labeled as follows:
* X-axis: Labeled "[0, 10]" and positioned horizontally.
* Y-axis: Not explicitly labeled, but implied to be the vertical axis.
* Z-axis: Labeled "[0, 11]" and positioned at an angle.
* **Colored Regions:** The pyramid's surface is divided into three regions:
* Reddish-Brown: Occupies the left side of the pyramid.
* Light Blue: Occupies the upper-right side of the pyramid.
* Pale Yellow: Occupies the lower-right side of the pyramid.
* **Apex:** The top point of the pyramid is labeled "[0,1]".
* **Base:** The base of the pyramid is defined by the coordinate axes.
### Detailed Analysis or Content Details
The diagram does not contain specific numerical data points beyond the axis labels. The colored regions visually represent different areas within the three-dimensional space defined by the pyramid. The pyramid's dimensions are approximately:
* X-axis range: 0 to 10 units.
* Z-axis range: 0 to 11 units.
* Y-axis range: 0 to 1 unit (based on the apex label).
The pyramid's base is a right triangle with vertices at (0,0,0), (10,0,0), and (0,0,11). The apex is located at (0,1,0).
### Key Observations
The diagram is a geometric representation rather than a data visualization. The color coding of the pyramid's faces does not appear to be associated with any specific values or quantities. The diagram's primary purpose is to illustrate the shape and spatial arrangement of a triangular pyramid within a three-dimensional coordinate system.
### Interpretation
The diagram likely represents a constraint region or a simplex in a three-dimensional space. The pyramid's shape defines the boundaries of a feasible region, and the colored regions may represent different sub-regions or categories within that space. The coordinate axes provide a framework for defining the position and extent of the pyramid. The diagram could be used to illustrate concepts in linear programming, optimization, or geometry. The lack of specific data points suggests that the diagram is intended to be a general illustration rather than a precise representation of a particular dataset. The apex label "[0,1]" suggests a possible normalization or scaling factor applied to the y-axis.