## Scatter Plot: Reasoning Tokens vs. Problem Size for o3-mini
### Overview
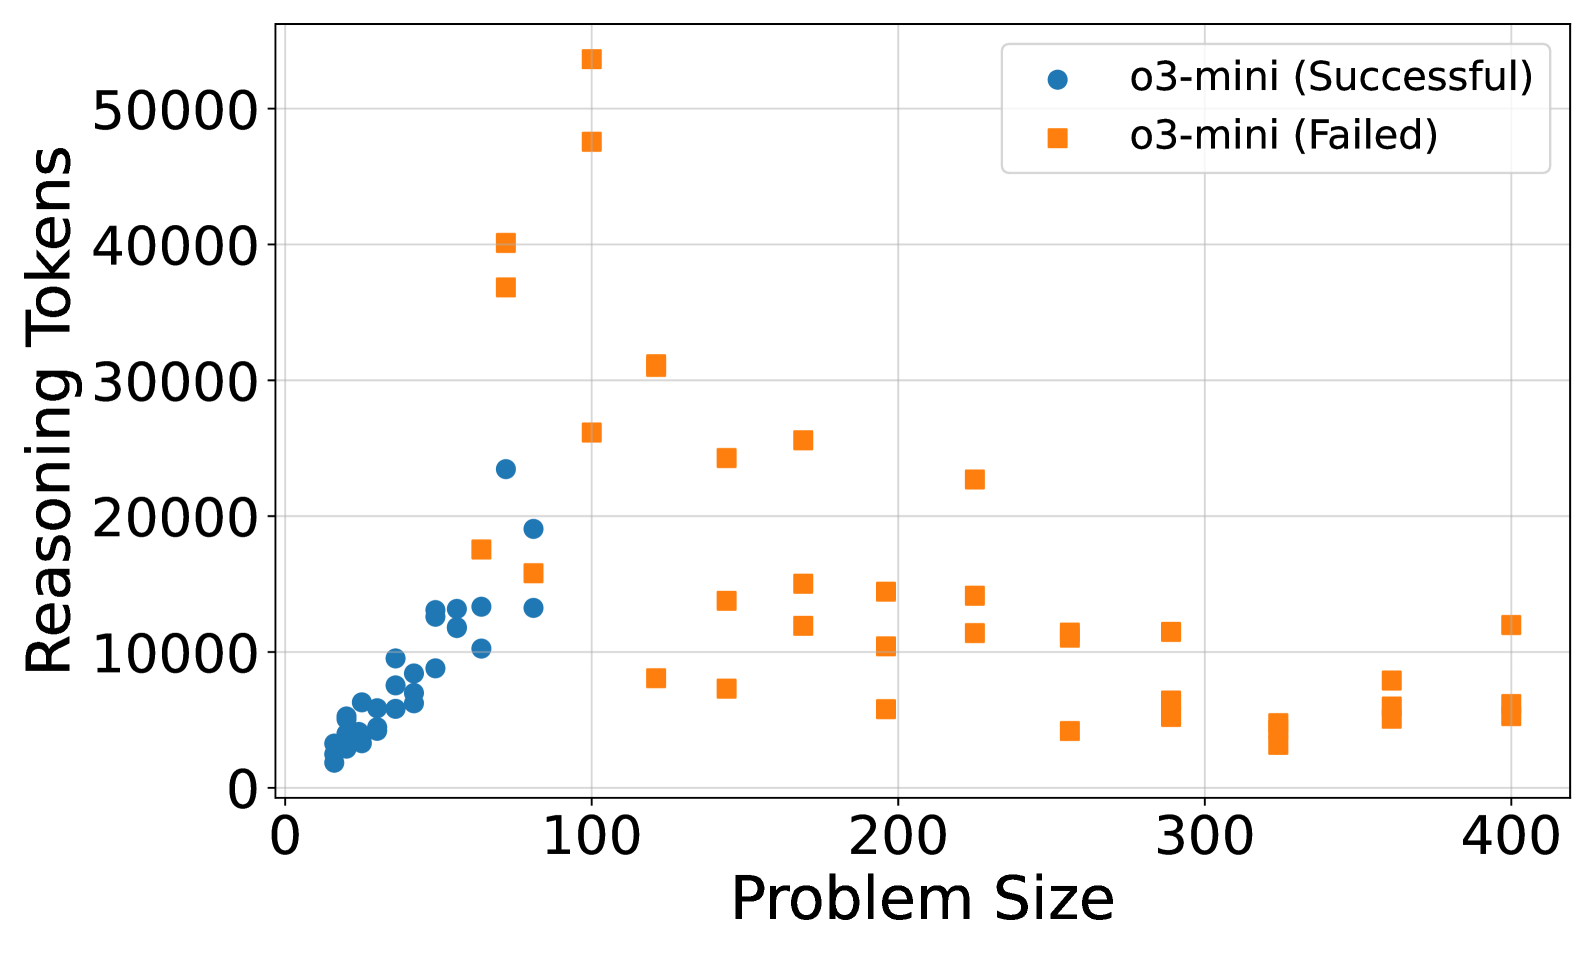
This is a scatter plot comparing the number of "Reasoning Tokens" used against "Problem Size" for a model or system identified as "o3-mini." The data is split into two categories: successful runs and failed runs. The plot reveals a distinct separation in the distribution and behavior of these two categories.
### Components/Axes
* **Chart Type:** Scatter Plot
* **X-Axis:**
* **Label:** "Problem Size"
* **Scale:** Linear, ranging from 0 to 400.
* **Major Tick Marks:** 0, 100, 200, 300, 400.
* **Y-Axis:**
* **Label:** "Reasoning Tokens"
* **Scale:** Linear, ranging from 0 to 50,000.
* **Major Tick Marks:** 0, 10000, 20000, 30000, 40000, 50000.
* **Legend:**
* **Position:** Top-right corner of the plot area.
* **Series 1:** Blue circle marker, labeled "o3-mini (Successful)".
* **Series 2:** Orange square marker, labeled "o3-mini (Failed)".
* **Grid:** Light gray gridlines are present for both axes.
### Detailed Analysis
**1. o3-mini (Successful) - Blue Circles:**
* **Spatial Grounding & Trend:** These data points are tightly clustered in the bottom-left quadrant of the plot. The trend shows a positive correlation: as Problem Size increases from approximately 10 to 80, the Reasoning Tokens used also increase, but remain below ~25,000.
* **Data Point Distribution (Approximate):**
* Problem Size ~10-30: Tokens range from ~2,000 to ~8,000.
* Problem Size ~30-60: Tokens range from ~8,000 to ~15,000.
* Problem Size ~60-80: Tokens range from ~10,000 to ~24,000. The highest token count for a successful run is approximately 24,000 at a Problem Size of about 75.
* **Key Characteristic:** No successful runs are plotted for Problem Sizes greater than approximately 80.
**2. o3-mini (Failed) - Orange Squares:**
* **Spatial Grounding & Trend:** These points are widely dispersed across the entire plot area. There is no single clear linear trend. The distribution suggests failures can occur with both low and high token usage across a wide range of problem sizes.
* **Data Point Distribution (Approximate):**
* **High-Token Failures (Outliers):** Several failures occur at relatively small Problem Sizes (50-150) but with extremely high token counts, including the highest points on the chart: ~54,000 tokens at Problem Size ~100 and ~48,000 tokens at Problem Size ~90.
* **Mid-Range Failures:** A cluster exists between Problem Size 100-250 with token counts scattered between ~5,000 and ~30,000.
* **Large-Problem Failures:** Failures are recorded for Problem Sizes up to 400. At these larger sizes (300-400), the token counts are generally lower, mostly between ~3,000 and ~12,000.
* **Key Characteristic:** Failed runs exist across the entire spectrum of Problem Size (from ~50 to 400) and Reasoning Tokens (from ~3,000 to ~54,000).
### Key Observations
1. **Clear Separation by Problem Size:** Successful runs are confined to Problem Sizes below ~80. All runs with Problem Size >80 are failures.
2. **Inverse Relationship for Failures at Extremes:** The highest token usage (potential overthinking/inefficiency) occurs for failures on moderately sized problems (~50-150). Failures on the largest problems (~300-400) use comparatively fewer tokens.
3. **Absence of Successful Large Problems:** The chart shows no data points for successful runs on problems larger than ~80, indicating a potential capability boundary for the o3-mini model in this test.
4. **Token Usage Variability:** Failed runs exhibit vastly greater variability in token consumption compared to the more predictable, lower-token successful runs.
### Interpretation
The data suggests a strong correlation between problem complexity (size) and the model's ability to succeed, with a clear threshold around a Problem Size of 80. The "Successful" series demonstrates efficient scaling: token usage grows moderately with problem size.
The "Failed" series tells a more complex story. The cluster of high-token failures at moderate problem sizes may indicate scenarios where the model engaged in extensive but unproductive reasoning, ultimately failing. Conversely, failures at very large problem sizes with lower token counts might suggest the model gave up early or failed to initiate a sufficiently deep reasoning process.
**Peircean Investigation:** The chart acts as a sign of the model's **performance envelope**. The tight blue cluster is an *icon* of efficient, successful processing within its comfort zone. The scattered orange squares are an *index* of failure modes: some point to inefficiency (high tokens), others to insufficient effort (low tokens on large problems). The stark boundary at Problem Size ~80 is a *symbol* of a hard limit in the model's tested capability. This visualization is crucial for diagnosing whether failures stem from computational inefficiency or fundamental inability.