\n
## Line Chart: Normalized Indices Over Time
### Overview
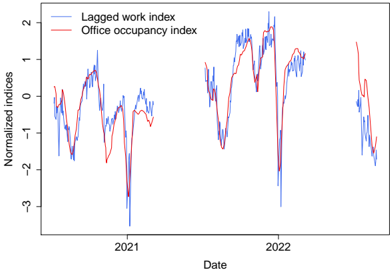
This image presents a line chart comparing two normalized indices – "Lagged work index" and "Office occupancy index" – over a period spanning approximately from the beginning of 2020 to the end of 2022. The chart aims to visualize the relationship and trends of these two indices over time.
### Components/Axes
* **X-axis:** Labeled "Date". The axis spans from approximately January 2020 to December 2022. The scale is not explicitly marked, but the years 2021 and 2022 are clearly indicated.
* **Y-axis:** Labeled "Normalized indices". The scale ranges from approximately -3 to 2. The scale is linear with increments of 1.
* **Legend:** Located in the top-left corner.
* "Lagged work index" – Represented by a blue line.
* "Office occupancy index" – Represented by a red line.
### Detailed Analysis
The chart displays two time series.
**Lagged Work Index (Blue Line):**
The blue line exhibits a generally fluctuating pattern.
* Early 2020: Starts around 0, dips to approximately -1.5, then recovers to around 1.
* 2021: Shows significant fluctuations, ranging from approximately -2.5 to 1.8. There are multiple peaks and troughs.
* 2022: Similar fluctuations to 2021, with a range of approximately -2.5 to 1.7.
* Late 2022: Declines from around 0.8 to approximately -1.5.
**Office Occupancy Index (Red Line):**
The red line also shows fluctuations, but appears to have a stronger correlation with the blue line, particularly in the timing of major dips.
* Early 2020: Starts around 0, dips to approximately -2, then recovers to around 0.5.
* 2021: Fluctuates between approximately -1.5 and 1.5.
* 2022: Similar fluctuations to 2021, with a range of approximately -2.5 to 1.5.
* Late 2022: Declines from around 0.5 to approximately -2.
**Specific Data Points (Approximate):**
* January 2020: Lagged Work Index ~ 0, Office Occupancy Index ~ 0
* Mid-2020: Lagged Work Index ~ 1, Office Occupancy Index ~ 0.5
* Early 2021: Lagged Work Index ~ -2.5, Office Occupancy Index ~ -1.5
* Mid-2021: Lagged Work Index ~ 1.8, Office Occupancy Index ~ 1.5
* Early 2022: Lagged Work Index ~ -2.5, Office Occupancy Index ~ -2.5
* Mid-2022: Lagged Work Index ~ 1.7, Office Occupancy Index ~ 1.5
* December 2022: Lagged Work Index ~ -1.5, Office Occupancy Index ~ -2
### Key Observations
* **Correlation:** The two indices appear to be correlated, with similar patterns of increase and decrease. The Office Occupancy Index tends to lag slightly behind the Lagged Work Index.
* **Dips:** Both indices experience significant dips in early 2020, 2021, and 2022. These dips likely correspond to periods of disruption (e.g., pandemic lockdowns).
* **Volatility:** Both indices exhibit high volatility throughout the period, indicating significant fluctuations in work and occupancy levels.
* **End of Period Decline:** Both indices show a clear decline towards the end of 2022.
### Interpretation
The chart suggests a strong relationship between work activity (as represented by the Lagged Work Index) and office occupancy. The dips in both indices likely reflect the impact of external factors, such as the COVID-19 pandemic and associated restrictions. The correlation suggests that changes in work patterns directly influence office occupancy rates. The decline at the end of 2022 could indicate a renewed shift in work arrangements, potentially towards remote or hybrid models, or a broader economic downturn. The "Lagged Work Index" suggests that changes in work patterns are observed *before* changes in office occupancy, which is logical as work arrangements would need to shift before impacting physical office space usage. The normalization of the indices allows for a comparison of trends despite potentially different scales or units of measurement for the underlying data. The chart provides valuable insights into the dynamics of work and office space utilization over a period of significant disruption and change.