## Chart Type: Multiple Scatter Plots and Parameter/Token Scaling
### Overview
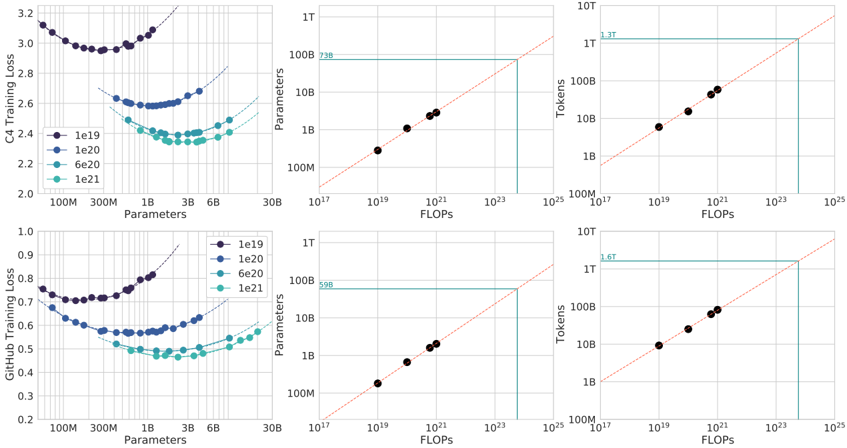
The image presents six scatter plots arranged in a 2x3 grid. The top row focuses on data related to "C4 Training Loss," while the bottom row focuses on "GitHub Training Loss." The first column shows training loss versus the number of parameters. The second column shows the relationship between parameters and FLOPs (floating-point operations per second). The third column shows the relationship between tokens and FLOPs. Each plot contains data for different parameter settings (1e19, 1e20, 6e20, and 1e21).
### Components/Axes
**First Column (Training Loss vs. Parameters):**
* **Y-axis (Left):** Training Loss (C4 or GitHub). Scale varies between the top and bottom plots.
* Top Plot (C4): Ranges from 2.0 to 3.2.
* Bottom Plot (GitHub): Ranges from 0.2 to 1.0.
* **X-axis (Bottom):** Parameters. Logarithmic scale with markers at 100M, 300M, 1B, 3B, 6B, and 30B.
* **Legend (Right of First Column):**
* Dark Blue: 1e19
* Blue: 1e20
* Light Blue: 6e20
* Teal: 1e21
**Second Column (Parameters/Tokens vs. FLOPs):**
* **Y-axis (Left):** Parameters (Top Plot) or Tokens (Bottom Plot). Logarithmic scale.
* Ranges from 100M to 1T.
* **X-axis (Bottom):** FLOPs. Logarithmic scale with markers at 10^17, 10^19, 10^21, 10^23, and 10^25.
* **Diagonal Line:** Dashed red line, indicating a 1:1 relationship.
* **Horizontal Teal Line:** Indicates a specific parameter/token value.
* Top Plot: Intersects the Y-axis at approximately 738B.
* Bottom Plot: Intersects the Y-axis at approximately 598B.
* **Vertical Teal Line:** Indicates a specific FLOPs value.
**Third Column (Tokens vs. FLOPs):**
* **Y-axis (Left):** Tokens. Logarithmic scale.
* Ranges from 100M to 10T.
* **X-axis (Bottom):** FLOPs. Logarithmic scale with markers at 10^17, 10^19, 10^21, 10^23, and 10^25.
* **Diagonal Line:** Dashed red line, indicating a 1:1 relationship.
* **Horizontal Teal Line:** Indicates a specific token value.
* Top Plot: Intersects the Y-axis at approximately 1.3T.
* Bottom Plot: Intersects the Y-axis at approximately 1.6T.
* **Vertical Teal Line:** Indicates a specific FLOPs value.
### Detailed Analysis
**First Column (Training Loss vs. Parameters):**
* **C4 Training Loss:**
* 1e19 (Dark Blue): Starts around 3.1 at 100M parameters, decreases to a minimum around 2.9 at 300M parameters, then increases again.
* 1e20 (Blue): Starts around 2.6 at 100M parameters, decreases to a minimum around 2.55 at 300M parameters, then increases slightly.
* 6e20 (Light Blue): Starts around 2.5 at 100M parameters, decreases to a minimum around 2.35 at 3B parameters, then increases slightly.
* 1e21 (Teal): Starts around 2.4 at 100M parameters, decreases to a minimum around 2.35 at 3B parameters, then increases slightly.
* **GitHub Training Loss:**
* 1e19 (Dark Blue): Starts around 0.75 at 100M parameters, decreases to a minimum around 0.7 at 300M parameters, then increases.
* 1e20 (Blue): Starts around 0.6 at 100M parameters, decreases to a minimum around 0.58 at 300M parameters, then increases.
* 6e20 (Light Blue): Starts around 0.55 at 100M parameters, decreases to a minimum around 0.45 at 3B parameters, then increases.
* 1e21 (Teal): Starts around 0.5 at 100M parameters, decreases to a minimum around 0.45 at 3B parameters, then increases.
**Second Column (Parameters/Tokens vs. FLOPs):**
* The black dots in both plots align closely with the dashed red line, indicating a roughly linear relationship between FLOPs and both Parameters and Tokens.
* The teal lines indicate the FLOPs required to reach a certain number of parameters or tokens.
* C4: 738B Parameters requires approximately 10^23 FLOPs.
* GitHub: 598B Parameters requires approximately 10^23 FLOPs.
**Third Column (Tokens vs. FLOPs):**
* The black dots in both plots align closely with the dashed red line, indicating a roughly linear relationship between FLOPs and Tokens.
* The teal lines indicate the FLOPs required to reach a certain number of tokens.
* C4: 1.3T Tokens requires approximately 10^24 FLOPs.
* GitHub: 1.6T Tokens requires approximately 10^24 FLOPs.
### Key Observations
* For both C4 and GitHub datasets, increasing the number of parameters (1e19 to 1e21) generally leads to a lower minimum training loss.
* The training loss initially decreases as the number of parameters increases, but eventually starts to increase again, suggesting an optimal parameter range.
* The relationship between FLOPs and both Parameters and Tokens is approximately linear on a log-log scale.
* The FLOPs required to reach a certain number of parameters or tokens are similar for both C4 and GitHub datasets.
### Interpretation
The plots demonstrate the relationship between model size (parameters), computational cost (FLOPs), dataset size (tokens), and training loss for two different datasets (C4 and GitHub). The data suggests that increasing model size and computational cost can reduce training loss, but there are diminishing returns. The linear relationship between FLOPs and parameters/tokens highlights the computational demands of training large language models. The teal lines provide specific estimates of the FLOPs required to train models of a certain size on these datasets. The U-shaped curves in the first column suggest that there is an optimal number of parameters for a given dataset and training regime, beyond which increasing the number of parameters may lead to overfitting and increased training loss.