## Data Table: Partially Filled 9x9 Sudoku Grid
### Overview
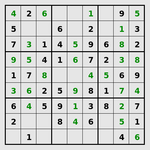
The image displays a standard 9x9 Sudoku puzzle grid. The grid is partially filled with single-digit integers (1-9). The cells are demarcated by thin black lines, with thicker lines delineating the nine 3x3 sub-grids (boxes). The background is white, and the numbers are printed in a clear, black, sans-serif font. No puzzle title, instructions, or other textual labels are present.
### Components/Axes
- **Structure:** A 9x9 grid composed of 81 individual cells.
- **Sub-grids:** The grid is divided into nine 3x3 boxes by thicker border lines.
- **Content:** Numerical digits (1-9) and empty cells. No axis labels, legends, or titles are present, as this is a puzzle grid, not a chart.
### Detailed Analysis
The following table reconstructs the state of the Sudoku grid. "Blank" indicates an empty cell. The grid is presented in standard Sudoku notation, with rows 1-9 from top to bottom and columns 1-9 from left to right.
| Row | Col 1 | Col 2 | Col 3 | Col 4 | Col 5 | Col 6 | Col 7 | Col 8 | Col 9 |
| :-- | :---- | :---- | :---- | :---- | :---- | :---- | :---- | :---- | :---- |
| **1** | 4 | 2 | 6 | Blank | 1 | Blank | 9 | 5 | Blank |
| **2** | 5 | Blank | Blank | Blank | Blank | 6 | Blank | 1 | 3 |
| **3** | 7 | 3 | 1 | 4 | 5 | 9 | 6 | 8 | 2 |
| **4** | 9 | 5 | 4 | 1 | 6 | 7 | 3 | Blank | Blank |
| **5** | 1 | 7 | 6 | Blank | Blank | Blank | 4 | 5 | 9 |
| **6** | 8 | Blank | Blank | 2 | 5 | 9 | 7 | 1 | 6 |
| **7** | 6 | 4 | 5 | 9 | 1 | 3 | 8 | 2 | 7 |
| **8** | 2 | Blank | 8 | 4 | 6 | Blank | 5 | 1 | Blank |
| **9** | Blank | 1 | Blank | Blank | Blank | Blank | Blank | 4 | 6 |
**Box Breakdown (3x3 Sub-grids):**
- **Box 1 (Top-Left):** Rows 1-3, Cols 1-3. Contains: 4,2,6 / 5,_,_ / 7,3,1
- **Box 2 (Top-Center):** Rows 1-3, Cols 4-6. Contains: _,1,_ / _,_,6 / 4,5,9
- **Box 3 (Top-Right):** Rows 1-3, Cols 7-9. Contains: 9,5,_ / _,1,3 / 6,8,2
- **Box 4 (Middle-Left):** Rows 4-6, Cols 1-3. Contains: 9,5,4 / 1,7,6 / 8,_,_
- **Box 5 (Center):** Rows 4-6, Cols 4-6. Contains: 1,6,7 / _,_,_ / 2,5,9
- **Box 6 (Middle-Right):** Rows 4-6, Cols 7-9. Contains: 3,_,_ / 4,5,9 / 7,1,6
- **Box 7 (Bottom-Left):** Rows 7-9, Cols 1-3. Contains: 6,4,5 / 2,_,8 / _,1,_
- **Box 8 (Bottom-Center):** Rows 7-9, Cols 4-6. Contains: 9,1,3 / 4,6,_ / _,_,_
- **Box 9 (Bottom-Right):** Rows 7-9, Cols 7-9. Contains: 8,2,7 / 5,1,_ / _,4,6
### Key Observations
1. **Density:** The grid is moderately filled. Of the 81 cells, 46 are pre-filled with numbers, and 35 are blank.
2. **Row Completeness:** Row 3 is completely filled. Rows 7 and 9 have the fewest filled cells (7 and 3, respectively).
3. **Column Completeness:** Column 7 is completely filled. Column 5 has the fewest filled cells (4).
4. **Box Completeness:** Box 3 (Top-Right) and Box 9 (Bottom-Right) are completely filled. Box 5 (Center) has the fewest filled cells (4).
5. **Number Distribution:** A quick visual scan suggests no immediate repetition of numbers within any row, column, or 3x3 box, adhering to the fundamental rule of Sudoku.
### Interpretation
This image presents a **logic puzzle in progress**. The data (the pre-filled numbers) constitutes the given clues for a Sudoku puzzle. The relationship between elements is defined by the rules of Sudoku: each row, each column, and each of the nine 3x3 boxes must contain the digits 1 through 9 exactly once.
The **informational content** is not a dataset to be analyzed for trends, but a **constraint satisfaction problem**. The "meaning" is found in the logical pathways a solver would use to deduce the missing numbers. For example:
* The complete Row 3 provides strong constraints for Columns 1-9 and Boxes 1-3.
* The nearly complete Column 7 (missing only one number in Row 4) allows for easy deduction of that missing digit.
* The sparse Center Box (Box 5) and Bottom-Center Box (Box 8) represent the areas of greatest uncertainty, requiring more complex cross-referencing with intersecting rows and columns to solve.
The puzzle appears to be of **moderate difficulty**. The presence of several nearly-complete rows, columns, and boxes provides good entry points for a solver, while the emptier regions in the center and bottom will require more advanced techniques. The ultimate "trend" or "pattern" hidden within this data is the unique, fully completed grid that satisfies all given constraints.