\n
## Violin Plot: Accuracy Comparison of Different Approaches
### Overview
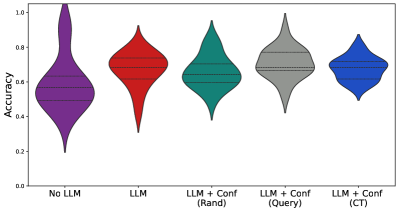
The image presents a violin plot comparing the accuracy of five different approaches. The x-axis represents the approach, and the y-axis represents the accuracy, ranging from 0.0 to 1.0. The violin plots visualize the distribution of accuracy scores for each approach.
### Components/Axes
* **X-axis:** Labels representing the different approaches: "No LLM", "LLM", "LLM + Conf (Rand)", "LLM + Conf (Query)", "LLM + Conf (CT)".
* **Y-axis:** Labeled "Accuracy", with a scale ranging from 0.0 to 1.0, with increments of 0.2.
* **Violin Plots:** Five violin plots, each representing the distribution of accuracy scores for a specific approach. The plots are colored as follows:
* "No LLM": Purple
* "LLM": Red
* "LLM + Conf (Rand)": Teal
* "LLM + Conf (Query)": Gray
* "LLM + Conf (CT)": Blue
### Detailed Analysis
The violin plots show the distribution of accuracy for each approach.
* **No LLM (Purple):** The distribution is relatively wide, ranging from approximately 0.1 to 1.0, with a peak around 0.8. The plot is somewhat asymmetrical, with a longer tail towards lower accuracy values.
* **LLM (Red):** The distribution is narrower than "No LLM", ranging from approximately 0.3 to 0.9, with a peak around 0.7.
* **LLM + Conf (Rand) (Teal):** The distribution is similar in width to "LLM", ranging from approximately 0.3 to 0.9, with a peak around 0.7.
* **LLM + Conf (Query) (Gray):** The distribution is wider than "LLM" and "LLM + Conf (Rand)", ranging from approximately 0.2 to 1.0, with a peak around 0.6.
* **LLM + Conf (CT) (Blue):** The distribution is relatively narrow, ranging from approximately 0.5 to 0.9, with a peak around 0.75.
### Key Observations
* "No LLM" has the widest distribution of accuracy, suggesting the most variability in performance.
* "LLM + Conf (CT)" appears to have the highest median accuracy, with a narrower distribution.
* "LLM" and "LLM + Conf (Rand)" have similar distributions.
* "LLM + Conf (Query)" has a wider distribution than the other LLM-based approaches.
### Interpretation
The data suggests that incorporating LLMs generally improves accuracy compared to not using an LLM ("No LLM"). The "LLM + Conf (CT)" approach appears to be the most effective, as it exhibits both a high median accuracy and a relatively narrow distribution, indicating consistent performance. The wider distribution of "No LLM" suggests that performance is highly variable without the use of an LLM. The "LLM + Conf (Query)" approach, while still showing improvement over "No LLM", has a wider distribution, indicating that its performance is less consistent than the other LLM-based approaches. The different "Conf" methods (Rand, Query, CT) likely represent different confidence estimation techniques, and the results suggest that the "CT" method is the most effective in conjunction with an LLM. The violin plots provide a visual representation of the spread and central tendency of the accuracy scores, allowing for a comparison of the different approaches.