## Pie Charts: Error Distribution Across AI Models (Search and Read w/o Demo)
### Overview
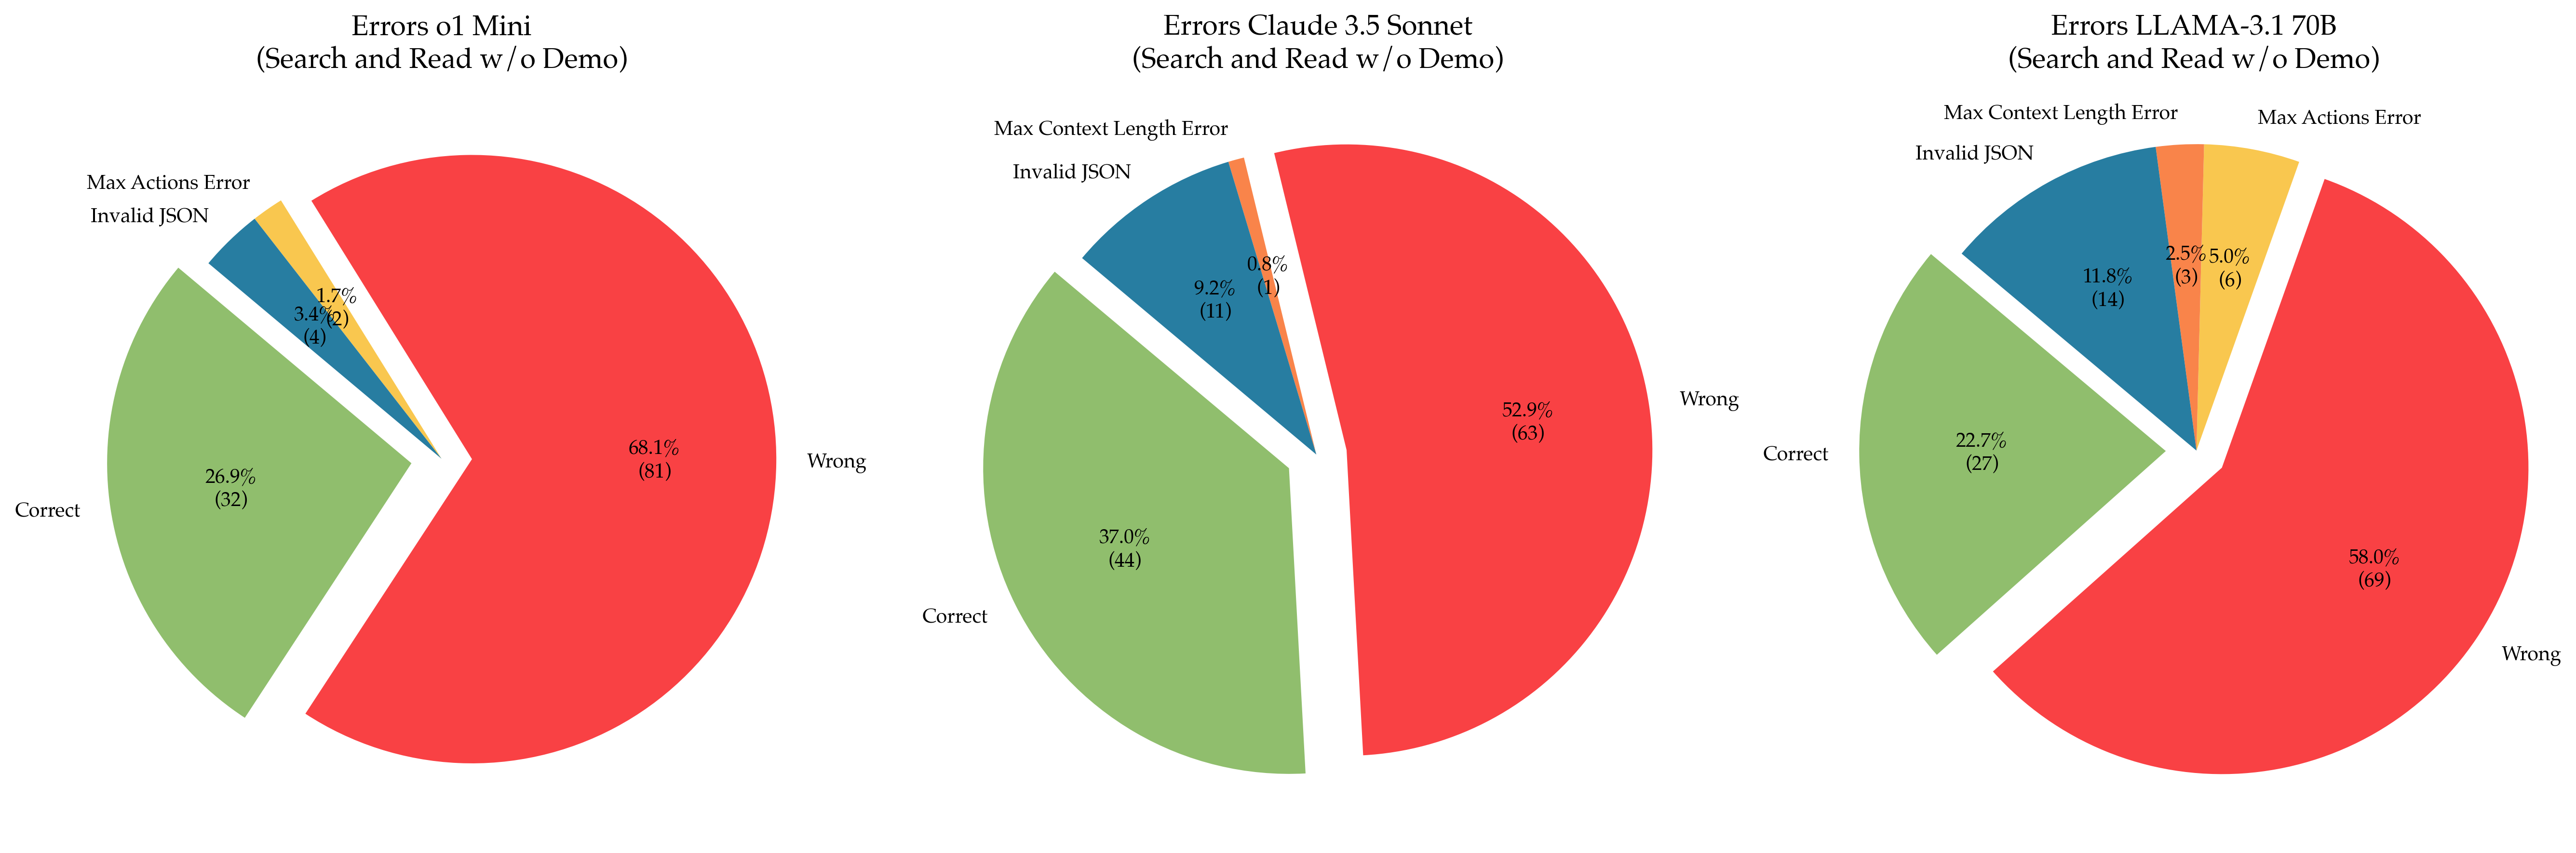
The image contains three pie charts comparing error distributions for three AI models:
1. **Errors o1 Mini**
2. **Errors Claude 3.5 Sonnet**
3. **Errors LLAMA-3.1 70B**
Each chart categorizes responses into:
- **Correct** (green)
- **Wrong** (red)
- **Max Actions Error** (yellow)
- **Invalid JSON** (blue)
- **Max Context Length Error** (orange)
Percentages and absolute counts are provided for each category.
---
### Components/Axes
#### Labels & Legends
- **X-Axis**: Not applicable (pie charts).
- **Y-Axis**: Not applicable (pie charts).
- **Legends**:
- **Red**: Wrong responses
- **Green**: Correct responses
- **Yellow**: Max Actions Error
- **Blue**: Invalid JSON
- **Orange**: Max Context Length Error
#### Textual Elements
- **Chart Titles**:
- "Errors o1 Mini (Search and Read w/o Demo)"
- "Errors Claude 3.5 Sonnet (Search and Read w/o Demo)"
- "Errors LLAMA-3.1 70B (Search and Read w/o Demo)"
- **Category Labels**:
- Correct, Wrong, Max Actions Error, Invalid JSON, Max Context Length Error
- **Percentages/Counts**:
- Displayed as percentages (e.g., 68.1%) and absolute counts (e.g., 81) in parentheses.
---
### Detailed Analysis
#### **Errors o1 Mini**
- **Wrong**: 68.1% (81 responses)
- **Correct**: 26.9% (32 responses)
- **Invalid JSON**: 3.4% (4 responses)
- **Max Actions Error**: 1.7% (2 responses)
- **Max Context Length Error**: Not present.
#### **Errors Claude 3.5 Sonnet**
- **Wrong**: 52.9% (63 responses)
- **Correct**: 37.0% (44 responses)
- **Invalid JSON**: 9.2% (11 responses)
- **Max Context Length Error**: 0.8% (1 response)
- **Max Actions Error**: Not present.
#### **Errors LLAMA-3.1 70B**
- **Wrong**: 58.0% (69 responses)
- **Correct**: 22.7% (27 responses)
- **Invalid JSON**: 11.8% (14 responses)
- **Max Actions Error**: 5.0% (6 responses)
- **Max Context Length Error**: 2.5% (3 responses)
---
### Key Observations
1. **Dominant Errors**:
- All models show **Wrong** responses as the largest category, with LLAMA-3.1 70B having the highest (58.0%).
- **o1 Mini** has the lowest Correct responses (26.9%), while **Claude 3.5 Sonnet** has the highest (37.0%).
2. **Error Variability**:
- **Invalid JSON** is most frequent in **LLAMA-3.1 70B** (11.8%) and **Claude 3.5 Sonnet** (9.2%).
- **Max Context Length Error** is unique to **Claude 3.5 Sonnet** (0.8%) and **LLAMA-3.1 70B** (2.5%).
- **Max Actions Error** appears only in **o1 Mini** (1.7%) and **LLAMA-3.1 70B** (5.0%).
3. **Model Performance**:
- **o1 Mini** has the highest error rate overall (68.1% Wrong).
- **LLAMA-3.1 70B** has the most diverse error types but the lowest Correct responses (22.7%).
---
### Interpretation
- **Model Strengths/Weaknesses**:
- **Claude 3.5 Sonnet** performs best in accuracy (37.0% Correct) but struggles with Invalid JSON (9.2%).
- **LLAMA-3.1 70B** has the highest error diversity, suggesting potential issues with handling complex tasks (e.g., Max Context Length and Max Actions).
- **o1 Mini** exhibits the highest failure rate, indicating possible limitations in task execution.
- **Error Patterns**:
- **Invalid JSON** and **Wrong** responses dominate across models, suggesting common issues in input parsing or logic.
- **Max Context Length Error** in Claude 3.5 Sonnet and LLAMA-3.1 70B may reflect constraints in handling long inputs.
- **Anomalies**:
- **o1 Mini** lacks Max Context Length Error, while **LLAMA-3.1 70B** has the most varied error types.
- **Max Actions Error** is disproportionately high in LLAMA-3.1 70B (5.0%), hinting at potential overuse of actions in certain tasks.
This data highlights trade-offs between model complexity and error profiles, with Claude 3.5 Sonnet showing the most balanced performance.