## Chart Type: Importance Score vs. Reasoning Step
### Overview
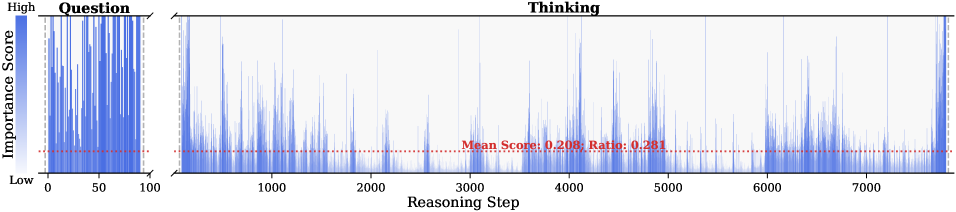
The image presents two adjacent charts visualizing importance scores. The left chart, labeled "Question," displays the distribution of importance scores for a question. The right chart, labeled "Thinking," shows the importance score across reasoning steps. Both charts use a blue color gradient to represent the importance score, with higher scores indicated by a darker shade of blue. A red dotted line indicates the mean score and ratio for the "Thinking" chart.
### Components/Axes
* **Left Chart (Question):**
* **Title:** Question
* **Y-axis:** Importance Score (gradient from Low to High)
* **X-axis:** Implicitly represents the question components, ranging from 0 to 100.
* **Right Chart (Thinking):**
* **Title:** Thinking
* **Y-axis:** Importance Score (same gradient as the left chart)
* **X-axis:** Reasoning Step, ranging from 0 to approximately 7500.
* **Mean Score Line:** A red dotted line across the "Thinking" chart, labeled "Mean Score: 0.208; Ratio: 0.281".
* **Color Gradient Legend:** Located on the left side of the "Question" chart, indicating the mapping of color to importance score (Low to High).
### Detailed Analysis
* **Question Chart:**
* The importance scores are widely distributed, with many instances reaching the "High" end of the scale.
* The distribution appears relatively uniform across the question components (0-100).
* **Thinking Chart:**
* The importance scores fluctuate significantly across the reasoning steps.
* There are several peaks where the importance score reaches high values.
* The density of high importance scores seems to decrease as the reasoning step increases.
* The mean score line is at 0.208, with a ratio of 0.281.
* The importance scores are generally below 0.6.
* The highest importance scores are observed in the early reasoning steps (0-1000).
* There are some spikes in importance score around reasoning steps 3500, 4200, 5800, and 7300.
### Key Observations
* The "Question" chart shows a high degree of importance across all question components.
* The "Thinking" chart reveals that the importance score varies significantly during the reasoning process, with a general decreasing trend as the reasoning step increases.
* The mean score and ratio provide a quantitative measure of the overall importance score during the reasoning process.
### Interpretation
The charts suggest that while the initial question components are considered highly important, the importance of individual steps in the reasoning process fluctuates. The decreasing trend in importance score over reasoning steps could indicate that later steps are considered less critical or that the model is losing focus as it progresses. The mean score and ratio provide a baseline for evaluating the importance of individual reasoning steps. The spikes in importance score at specific reasoning steps might indicate key decision points or critical sub-tasks within the reasoning process. The difference in distribution between the "Question" and "Thinking" charts highlights the dynamic nature of importance during the reasoning process compared to the static importance of the initial question.