## Heatmap/Bar Chart: Importance Score Across Reasoning Steps
### Overview
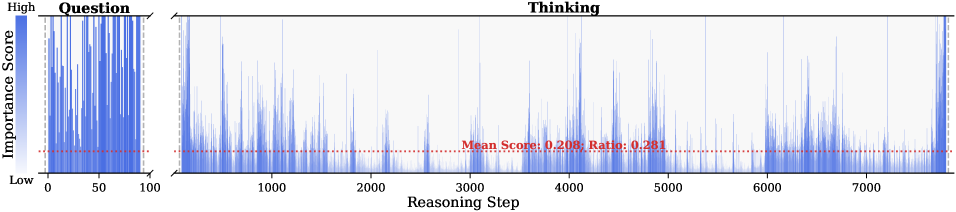
The image displays a two-part horizontal bar chart or heatmap visualizing "Importance Score" across a sequence of "Reasoning Step" values. The chart is divided into two distinct sections labeled "Question" and "Thinking," separated by a break in the x-axis. A horizontal red dashed line indicates a mean threshold across the entire dataset.
### Components/Axes
* **Chart Title/Sections:**
* **Left Section:** Labeled "Question" at the top. This section covers Reasoning Steps from 0 to 100.
* **Right Section:** Labeled "Thinking" at the top. This section covers Reasoning Steps from approximately 1000 to over 7000.
* **Y-Axis (Vertical):**
* **Label:** "Importance Score" (written vertically on the left side).
* **Scale:** A continuous gradient from "Low" (bottom, white/light color) to "High" (top, dark blue). The axis itself is not numerically labeled, but the color intensity represents the score.
* **X-Axis (Horizontal):**
* **Label:** "Reasoning Step" (centered at the bottom).
* **Scale (Question Section):** Linear scale with major ticks at 0, 50, and 100.
* **Scale (Thinking Section):** Linear scale with major ticks at 1000, 2000, 3000, 4000, 5000, 6000, and 7000. The axis extends slightly beyond 7000.
* **Legend/Key:** There is no separate legend box. The color gradient on the y-axis serves as the key, mapping blue intensity to importance score magnitude.
* **Annotation:** A horizontal red dashed line runs across the entire width of both chart sections. Centered over the "Thinking" section, red text is placed just above this line: **"Mean Score: 0.206, Ratio: 0.281"**.
### Detailed Analysis
* **Data Representation:** Each vertical line or thin bar corresponds to a single "Reasoning Step." Its color intensity (from white to dark blue) represents the "Importance Score" for that step.
* **"Question" Section (Steps 0-100):**
* **Trend:** This section shows consistently high importance scores. The bars are predominantly dark blue, forming a dense, nearly solid block of color from the bottom to the top of the chart area. There is very little variation or white space, indicating that nearly all steps in this initial phase are assigned high importance.
* **"Thinking" Section (Steps ~1000-7000+):**
* **Trend:** This section shows high variability. The pattern is a series of spikes and clusters.
* **Pattern:** There are numerous isolated or clustered dark blue spikes indicating steps with high importance scores. These are interspersed with large areas of lighter blue or white, indicating many steps with low to moderate importance scores. The distribution appears non-uniform, with some dense clusters of activity (e.g., around steps 1000-1500, 3000-3500, 4000-4500, and 6000-6500) and other relatively quiet periods.
* **Red Threshold Line:**
* The line is positioned at a constant y-value, visually estimated to be around 20-25% of the height from the "Low" baseline.
* The annotation states the **Mean Score is 0.206**. Assuming the "Low" baseline is 0.0 and "High" is 1.0, this line represents that average.
* The **Ratio is 0.281**. This likely represents the proportion of reasoning steps (in the "Thinking" section, or overall) that have an importance score above this mean threshold.
### Key Observations
1. **Phase Dichotomy:** There is a stark contrast between the "Question" phase (uniformly high importance) and the "Thinking" phase (highly variable importance).
2. **Sporadic High-Importance Events:** The "Thinking" phase is characterized by sporadic bursts of high-importance reasoning steps, not a sustained high level of importance.
3. **Meaning of the Ratio:** The ratio of 0.281 suggests that only about 28.1% of the reasoning steps (likely in the extended "Thinking" phase) are considered above-average in importance.
4. **Scale Disparity:** The "Thinking" phase involves a vastly greater number of steps (thousands) compared to the brief "Question" phase (100 steps).
### Interpretation
This chart likely visualizes the internal process of an AI or cognitive model during a task. The **"Question" phase** represents the initial processing of the input query, where every step is deemed critical for understanding the task, hence uniformly high importance. The subsequent **"Thinking" phase** represents the model's internal reasoning or generation process. Here, importance is not constant; the model engages in many low-importance steps (possibly routine computation, exploration, or filler) punctuated by key moments of high-importance reasoning, insight, or decision-making (the dark blue spikes).
The **mean score (0.206)** sets a baseline for "average importance." The **ratio (0.281)** is a key metric, indicating that the model's reasoning is sparse in terms of high-impact steps—only about a quarter of its thinking steps are above average in importance. This could be interpreted as efficiency (most steps are low-cost) or as a sign of a process where critical insights are rare events within a sea of background computation. The visualization argues that not all reasoning steps are equal; understanding a problem ("Question") is uniformly critical, while solving it ("Thinking") involves a long tail of low-importance work with intermittent high-value cognitive events.