## Chart: HMC Performance Comparison
### Overview
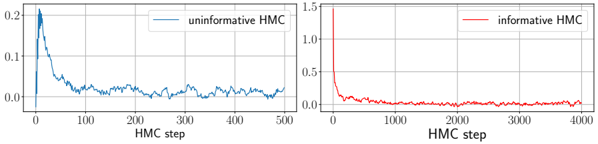
The image presents two line charts side-by-side, comparing the performance of "uninformative HMC" and "informative HMC" algorithms. The x-axis represents the HMC step, and the y-axis represents an unspecified performance metric. The charts illustrate how the performance metric changes over the course of the HMC steps for each algorithm.
### Components/Axes
**Left Chart (Uninformative HMC):**
* **X-axis:** "HMC step", ranging from 0 to 500. Axis markers are present at 0, 100, 200, 300, 400, and 500.
* **Y-axis:** Scale ranges from 0.0 to 0.2. Axis markers are present at 0.0, 0.1, and 0.2.
* **Legend:** Located in the top-right corner, labeled "uninformative HMC" and associated with a blue line.
**Right Chart (Informative HMC):**
* **X-axis:** "HMC step", ranging from 0 to 4000. Axis markers are present at 0, 1000, 2000, 3000, and 4000.
* **Y-axis:** Scale ranges from 0.0 to 1.5. Axis markers are present at 0.0, 0.5, 1.0, and 1.5.
* **Legend:** Located in the top-right corner, labeled "informative HMC" and associated with a red line.
### Detailed Analysis
**Left Chart (Uninformative HMC):**
* **Trend:** The blue line representing "uninformative HMC" starts at approximately 0.0, rapidly increases to a peak around 0.2 at the beginning, then quickly decreases and stabilizes around 0.02 after approximately 100 steps. The line fluctuates slightly around this value for the remainder of the steps.
* **Data Points:**
* Initial value (step 0): ~0.0
* Peak value (around step 10): ~0.2
* Stabilized value (after step 100): ~0.02
**Right Chart (Informative HMC):**
* **Trend:** The red line representing "informative HMC" starts at a high value of approximately 1.5, rapidly decreases to around 0.1 within the first 500 steps, and then gradually stabilizes around 0.02 after approximately 1000 steps. The line fluctuates slightly around this value for the remainder of the steps.
* **Data Points:**
* Initial value (step 0): ~1.5
* Value at step 500: ~0.1
* Stabilized value (after step 1000): ~0.02
### Key Observations
* Both algorithms show a rapid initial decrease in the performance metric.
* The "informative HMC" algorithm starts with a significantly higher value than the "uninformative HMC" algorithm.
* Both algorithms stabilize at approximately the same value (~0.02) after a certain number of steps.
* The "informative HMC" algorithm requires more steps to stabilize compared to the "uninformative HMC" algorithm.
### Interpretation
The charts suggest that while the "informative HMC" algorithm initially performs worse (higher value on the y-axis, which is assumed to be an error or loss metric), it eventually converges to a similar performance level as the "uninformative HMC" algorithm. The "informative HMC" algorithm's initial higher value could be due to a more complex model or a less optimal starting point. The fact that both algorithms converge to a similar value suggests that, given enough steps, the "informative HMC" can achieve comparable performance. The "uninformative HMC" converges faster, possibly because it is a simpler model or starts from a better initial state. The y-axis label is missing, so the exact meaning of the performance metric is unknown, but the trends suggest it is a measure of error or loss that the algorithms are trying to minimize.