## Map Visualization: Paris Bike Sharing System
### Overview
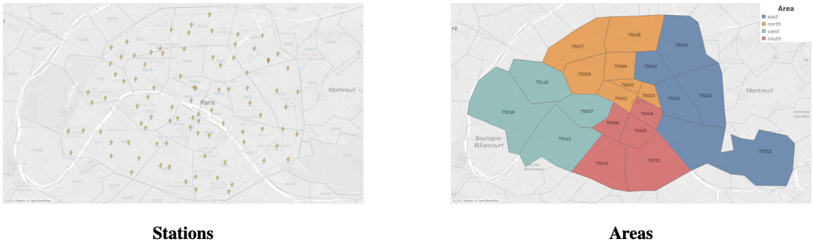
The image presents two maps of the Paris metropolitan area, visualizing data related to a bike sharing system. The left map displays the locations of bike stations, while the right map shows the division of Paris into areas, likely representing zones or administrative districts, with associated data.
### Components/Axes
**Left Map (Stations):**
* **Title:** "Stations"
* **Map Features:** Depicts the city of Paris and surrounding areas, including labels for "Paris", "Montreuil", and "Boulogne-Billancourt".
* **Markers:** Numerous small, gold-colored markers representing bike stations are scattered throughout the map. No axis or scale is visible.
**Right Map (Areas):**
* **Title:** "Areas"
* **Map Features:** Depicts the city of Paris and surrounding areas, including labels for "Paris", "Montreuil", and "Boulogne-Billancourt".
* **Areas:** The map is divided into irregularly shaped polygons, each representing an area. Each area is filled with a different color.
* **Legend (Top-Right):**
* **Title:** "Area"
* **Categories:** "east", "west", "north", "south"
* **Colors:**
* East: Blue
* West: Orange
* North: Teal
* South: Red
* **Area Labels:** Each area is labeled with a four-digit number (e.g., "75008", "75009", "75011").
### Detailed Analysis or Content Details
**Left Map (Stations):**
* The stations are densely concentrated within the central areas of Paris, particularly within the inner ring of arrondissements.
* Station density decreases significantly in the outer suburbs.
* There are approximately 100-150 stations visible, but an exact count is difficult due to overlap and map resolution.
**Right Map (Areas):**
* **Area Data (Approximate, based on visual inspection):**
* **75001:** Blue (East)
* **75002:** Orange (West)
* **75003:** Orange (West)
* **75004:** Orange (West)
* **75005:** Orange (West)
* **75006:** Orange (West)
* **75007:** Orange (West)
* **75008:** Orange (West)
* **75009:** Teal (North)
* **75010:** Teal (North)
* **75011:** Teal (North)
* **75012:** Teal (North)
* **75013:** Red (South)
* **75014:** Red (South)
* **75015:** Red (South)
* **75016:** Orange (West)
* **75017:** Teal (North)
* **75018:** Teal (North)
* **75019:** Teal (North)
* **75020:** Red (South)
* The areas are not uniformly sized or shaped.
* The color distribution suggests a roughly quadrant-based division of Paris into East, West, North, and South zones.
### Key Observations
* The bike station distribution is strongly correlated with population density and central urban areas.
* The area division appears to be based on administrative or geographical boundaries.
* The areas are labeled with postal codes (750xx), indicating arrondissements.
* The color coding of areas provides a visual categorization, potentially representing different characteristics or data associated with each zone.
### Interpretation
The data suggests a bike sharing system designed to serve the densely populated central areas of Paris. The station distribution reflects this, with a significant concentration of stations within the inner arrondissements. The division of Paris into areas (East, West, North, South) likely represents a segmentation for data analysis or operational management of the bike sharing system. The areas could be used to track usage patterns, identify areas for expansion, or manage maintenance and logistics. The correlation between area color and arrondissement number suggests a deliberate mapping of administrative boundaries to the defined zones. The lack of numerical data associated with each area (e.g., number of bikes, usage rates) limits a deeper analysis, but the visualization provides a clear overview of the system's spatial distribution and zonal organization.