## Line Chart: Benchmark: MATH500
### Overview
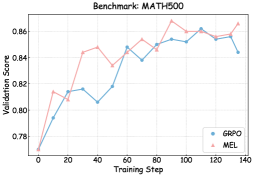
The image is a line chart comparing the validation score performance of two different methods, labeled "GAPO" and "MEL," over the course of training steps on a benchmark dataset called "MATH500." The chart displays two fluctuating lines that generally trend upward, indicating improving performance with more training.
### Components/Axes
* **Chart Title:** "Benchmark: MATH500" (centered at the top).
* **X-Axis:** Labeled "Training Step." The axis is linear and marked with major ticks at intervals of 20, ranging from 0 to 140.
* **Y-Axis:** Labeled "Validation Score." The axis is linear and marked with major ticks at intervals of 0.02, ranging from 0.78 to 0.86.
* **Legend:** Located in the bottom-right corner of the plot area. It contains two entries:
* A blue line with circular markers labeled "GAPO".
* A red line with triangular markers labeled "MEL".
### Detailed Analysis
**Data Series: GAPO (Blue line with circles)**
* **Trend:** The line shows an overall upward trend with significant volatility. It starts low, rises sharply, experiences a notable dip, recovers, and reaches its peak towards the later steps before a final decline.
* **Approximate Data Points:**
* Step 0: ~0.78
* Step 10: ~0.80
* Step 20: ~0.81
* Step 30: ~0.82
* Step 40: ~0.82
* Step 50: ~0.805 (notable dip)
* Step 60: ~0.845
* Step 70: ~0.835
* Step 80: ~0.85
* Step 90: ~0.855
* Step 100: ~0.85
* Step 110: ~0.855
* Step 120: ~0.86 (peak)
* Step 130: ~0.855
* Step 140: ~0.845
**Data Series: MEL (Red line with triangles)**
* **Trend:** The line also shows an overall upward trend but with a different pattern. It starts higher than GAPO, rises quickly to an early peak, fluctuates, reaches its maximum, and then shows a clear downward trend in the final steps.
* **Approximate Data Points:**
* Step 0: ~0.80
* Step 10: ~0.815
* Step 20: ~0.805
* Step 30: ~0.845
* Step 40: ~0.85
* Step 50: ~0.84
* Step 60: ~0.845
* Step 70: ~0.855
* Step 80: ~0.86 (peak)
* Step 90: ~0.85
* Step 100: ~0.855
* Step 110: ~0.85
* Step 120: ~0.855
* Step 130: ~0.85
* Step 140: ~0.84
### Key Observations
1. **Initial Performance:** MEL starts with a higher validation score (~0.80) than GAPO (~0.78) at step 0.
2. **Crossover Points:** The two lines intersect approximately at step 60 and again near step 100, indicating points where their performance was nearly identical.
3. **Peak Timing:** MEL reaches its peak performance (~0.86) earlier, around step 80. GAPO reaches its similar peak (~0.86) later, around step 120.
4. **Volatility:** Both methods show considerable step-to-step fluctuation, suggesting the training process or evaluation metric is noisy.
5. **Final Trend:** In the last 20 steps (120-140), the MEL line shows a more consistent downward trend, while the GAPO line's decline is less pronounced after its later peak.
### Interpretation
This chart visualizes a comparative training run for two algorithms or model variants (GAPO and MEL) on the MATH500 benchmark. The "Validation Score" is the key performance metric.
The data suggests that **MEL may learn faster initially**, achieving higher scores in the first third of the training steps. However, its performance peaks earlier and begins to degrade, which could be a sign of **overfitting** to the training data or instability in the later stages of optimization.
In contrast, **GAPO shows a more sustained, albeit noisier, improvement** over a longer period. Its later peak suggests it might be more robust or continue to benefit from extended training. The significant dip around step 50 for GAPO is an anomaly that could correspond to a specific event in the training process, such as a learning rate change or a challenging batch of data.
The overall takeaway is a trade-off: MEL offers quicker gains, while GAPO demonstrates potentially more stable long-term learning. The choice between them would depend on the available training budget (steps) and the importance of peak performance versus training stability. The volatility in both lines indicates that evaluating performance at a single step might be misleading; observing the trend over time is crucial.