## Line Graph: Benchmark MATH500 Validation Scores
### Overview
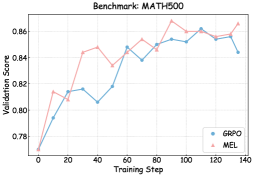
The image displays a line graph comparing the validation scores of two models (GRPO and MEL) across training steps on the MATH500 benchmark. The x-axis represents training steps (0–140), and the y-axis represents validation scores (0.78–0.86). Two data series are plotted: GRPO (blue line) and MEL (pink line).
### Components/Axes
- **X-axis**: "Training Step" (0–140, increments of 20)
- **Y-axis**: "Validation Score" (0.78–0.86, increments of 0.02)
- **Legend**: Located in the bottom-right corner, with:
- Blue circle labeled "GRPO"
- Pink triangle labeled "MEL"
### Detailed Analysis
#### GRPO (Blue Line)
- **Initial Phase**: Starts at 0.78 (step 0), rises sharply to 0.81 by step 20.
- **Mid-Phase**: Dips to 0.80 at step 40, then climbs to 0.84 by step 60.
- **Late Phase**: Peaks at 0.86 around step 100, stabilizes at ~0.85 by step 140.
- **Key Values**:
- Step 0: 0.78
- Step 20: 0.81
- Step 40: 0.80
- Step 60: 0.84
- Step 80: 0.85
- Step 100: 0.86
- Step 120: 0.85
- Step 140: 0.84
#### MEL (Pink Line)
- **Initial Phase**: Begins at 0.77 (step 0), jumps to 0.81 by step 20.
- **Mid-Phase**: Dips to 0.83 at step 40, rises to 0.85 by step 60.
- **Late Phase**: Peaks at 0.87 around step 90, fluctuates between 0.85–0.87 until step 140.
- **Key Values**:
- Step 0: 0.77
- Step 20: 0.81
- Step 40: 0.83
- Step 60: 0.85
- Step 80: 0.84
- Step 90: 0.87
- Step 110: 0.86
- Step 130: 0.85
- Step 140: 0.87
### Key Observations
1. **Trend Direction**: Both lines show an overall upward trend, but MEL exhibits greater volatility.
2. **Performance Gap**: MEL consistently outperforms GRPO in later stages (steps 80–140), with a maximum score of 0.87 vs. GRPO's 0.86.
3. **Volatility**: MEL's line has sharper peaks and troughs (e.g., drop from 0.87 at step 90 to 0.85 at step 110), while GRPO's trajectory is smoother.
4. **Convergence**: By step 140, both models plateau near 0.85–0.87, suggesting diminishing returns after extensive training.
### Interpretation
The graph demonstrates that MEL achieves higher validation scores on the MATH500 benchmark but with greater instability compared to GRPO. The MEL model's volatility might indicate overfitting or sensitivity to training dynamics, whereas GRPO's steadier progression suggests robustness. The convergence at later steps implies both models reach similar performance ceilings, but MEL's higher peaks could justify its use in scenarios prioritizing maximum accuracy despite variability. The initial dip in GRPO's score at step 40 may reflect a learning phase adjustment, while MEL's early rise highlights rapid early learning. These patterns underscore trade-offs between stability and peak performance in model selection.