\n
## [Multi-Panel Line Chart]: Performance of Different Methods on Six Question Answering Datasets
### Overview
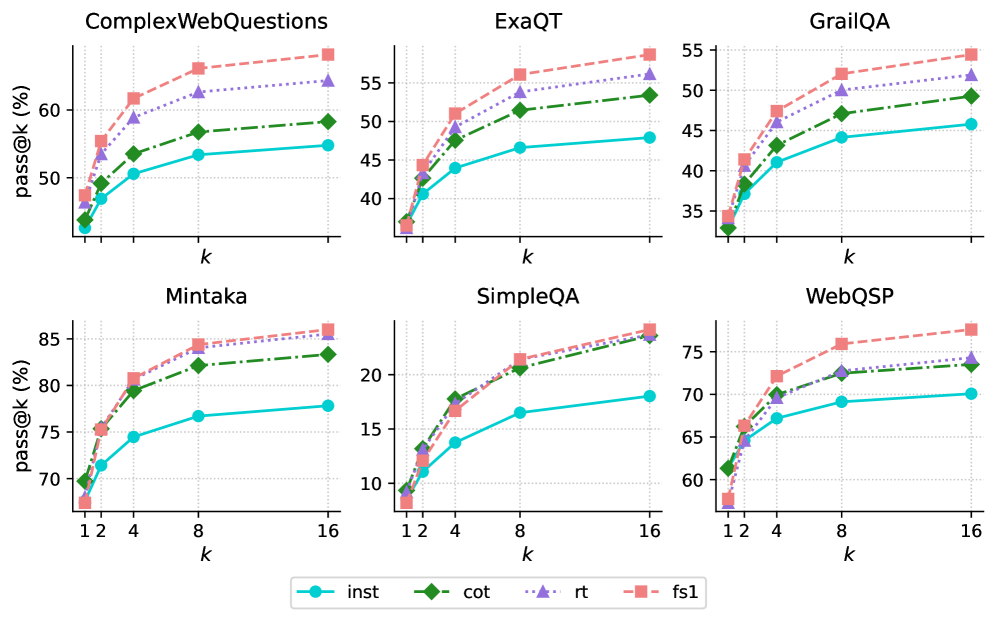
The image displays six separate line charts arranged in a 2x3 grid. Each chart plots the performance of four different methods on a specific question answering (QA) dataset. Performance is measured by the "pass@k (%)" metric as a function of the parameter "k". All charts show a consistent pattern where performance improves with increasing "k", but the absolute performance levels and the relative ranking of methods vary across datasets.
### Components/Axes
* **Titles:** Six dataset names, one above each chart: `ComplexWebQuestions`, `ExaQT`, `GrailQA`, `Mintaka`, `SimpleQA`, `WebQSP`.
* **Y-Axis:** Labeled `pass@k (%)` for all charts. The scale varies:
* ComplexWebQuestions: ~45% to ~65%
* ExaQT: ~35% to ~58%
* GrailQA: ~33% to ~55%
* Mintaka: ~68% to ~86%
* SimpleQA: ~8% to ~24%
* WebQSP: ~58% to ~78%
* **X-Axis:** Labeled `k` for all charts. The markers are at values 1, 2, 4, 8, and 16.
* **Legend:** Positioned at the bottom center of the entire figure. It defines four data series:
* `inst`: Cyan solid line with circle markers.
* `cot`: Green dashed line with diamond markers.
* `rt`: Purple dotted line with upward-pointing triangle markers.
* `fs1`: Salmon (light red) dashed line with square markers.
### Detailed Analysis
**1. ComplexWebQuestions (Top-Left)**
* **Trend:** All four methods show a steep initial increase from k=1 to k=4, followed by a more gradual rise to k=16.
* **Data Points (Approximate):**
* `fs1` (Salmon, Square): Starts ~48%, ends ~64%.
* `rt` (Purple, Triangle): Starts ~47%, ends ~63%.
* `cot` (Green, Diamond): Starts ~45%, ends ~59%.
* `inst` (Cyan, Circle): Starts ~44%, ends ~55%.
* **Ranking (at k=16):** `fs1` > `rt` > `cot` > `inst`.
**2. ExaQT (Top-Center)**
* **Trend:** Similar logarithmic growth pattern. The gap between `fs1`/`rt` and `cot`/`inst` widens as k increases.
* **Data Points (Approximate):**
* `fs1`: Starts ~37%, ends ~58%.
* `rt`: Starts ~36%, ends ~56%.
* `cot`: Starts ~36%, ends ~53%.
* `inst`: Starts ~36%, ends ~48%.
* **Ranking (at k=16):** `fs1` > `rt` > `cot` > `inst`.
**3. GrailQA (Top-Right)**
* **Trend:** Consistent upward trend. The performance hierarchy is clear and maintained across all k.
* **Data Points (Approximate):**
* `fs1`: Starts ~34%, ends ~54%.
* `rt`: Starts ~34%, ends ~52%.
* `cot`: Starts ~33%, ends ~49%.
* `inst`: Starts ~33%, ends ~46%.
* **Ranking (at k=16):** `fs1` > `rt` > `cot` > `inst`.
**4. Mintaka (Bottom-Left)**
* **Trend:** Strong upward trend. The top three methods (`fs1`, `rt`, `cot`) are tightly clustered, while `inst` lags significantly.
* **Data Points (Approximate):**
* `fs1`: Starts ~68%, ends ~86%.
* `rt`: Starts ~69%, ends ~85%.
* `cot`: Starts ~70%, ends ~83%.
* `inst`: Starts ~69%, ends ~78%.
* **Ranking (at k=16):** `fs1` ≈ `rt` > `cot` > `inst`.
**5. SimpleQA (Bottom-Center)**
* **Trend:** All methods show improvement. The `rt` and `fs1` lines nearly overlap at the top, while `cot` and `inst` are distinctly lower.
* **Data Points (Approximate):**
* `fs1`: Starts ~9%, ends ~24%.
* `rt`: Starts ~9%, ends ~24%.
* `cot`: Starts ~9%, ends ~24% (appears to converge with top two at k=16).
* `inst`: Starts ~9%, ends ~18%.
* **Ranking (at k=16):** `fs1` ≈ `rt` ≈ `cot` > `inst`.
**6. WebQSP (Bottom-Right)**
* **Trend:** Clear logarithmic growth. A distinct separation exists between the top method (`fs1`) and the others.
* **Data Points (Approximate):**
* `fs1`: Starts ~58%, ends ~78%.
* `rt`: Starts ~61%, ends ~74%.
* `cot`: Starts ~61%, ends ~73%.
* `inst`: Starts ~61%, ends ~70%.
* **Ranking (at k=16):** `fs1` > `rt` ≈ `cot` > `inst`.
### Key Observations
1. **Universal Trend:** Across all six datasets, the `pass@k` metric increases with `k` for every method, demonstrating the benefit of generating more candidate answers.
2. **Consistent Method Hierarchy:** The `fs1` method (salmon squares) is consistently the top or tied-for-top performer. The `inst` method (cyan circles) is consistently the lowest performer.
3. **Dataset Difficulty:** The absolute `pass@k` values vary greatly, indicating differing dataset difficulty. `SimpleQA` appears the most challenging (max ~24%), while `Mintaka` appears the easiest (max ~86%).
4. **Convergence at High k:** On several datasets (`SimpleQA`, `Mintaka`), the performance of the top methods (`fs1`, `rt`, `cot`) converges as `k` increases to 16.
### Interpretation
This visualization compares the efficacy of four different prompting or reasoning strategies (`inst`: instruction-only, `cot`: chain-of-thought, `rt`: self-refinement or similar, `fs1`: few-shot with one example) for large language models on knowledge-intensive QA tasks.
The data suggests that **providing examples (`fs1`) or structured reasoning steps (`cot`, `rt`) consistently outperforms simple instruction (`inst`)**. The advantage of these advanced methods is robust across diverse QA formats and difficulty levels. The `pass@k` metric's rise with `k` underscores a key strategy in LLM deployment: generating multiple candidate answers and using a verifier or voting mechanism to select the best one significantly boosts reliability. The convergence of top methods at high `k` on some datasets implies that with enough candidate generations, the specific prompting strategy may become less critical, though `fs1` maintains a slight edge. The stark difference in absolute performance between datasets like `SimpleQA` and `Mintaka` highlights the importance of benchmarking across a varied suite of tasks to get a complete picture of model capability.