## Line Chart: LongBench Accuracy vs KV Cache Size (MFQA Dataset)
### Overview
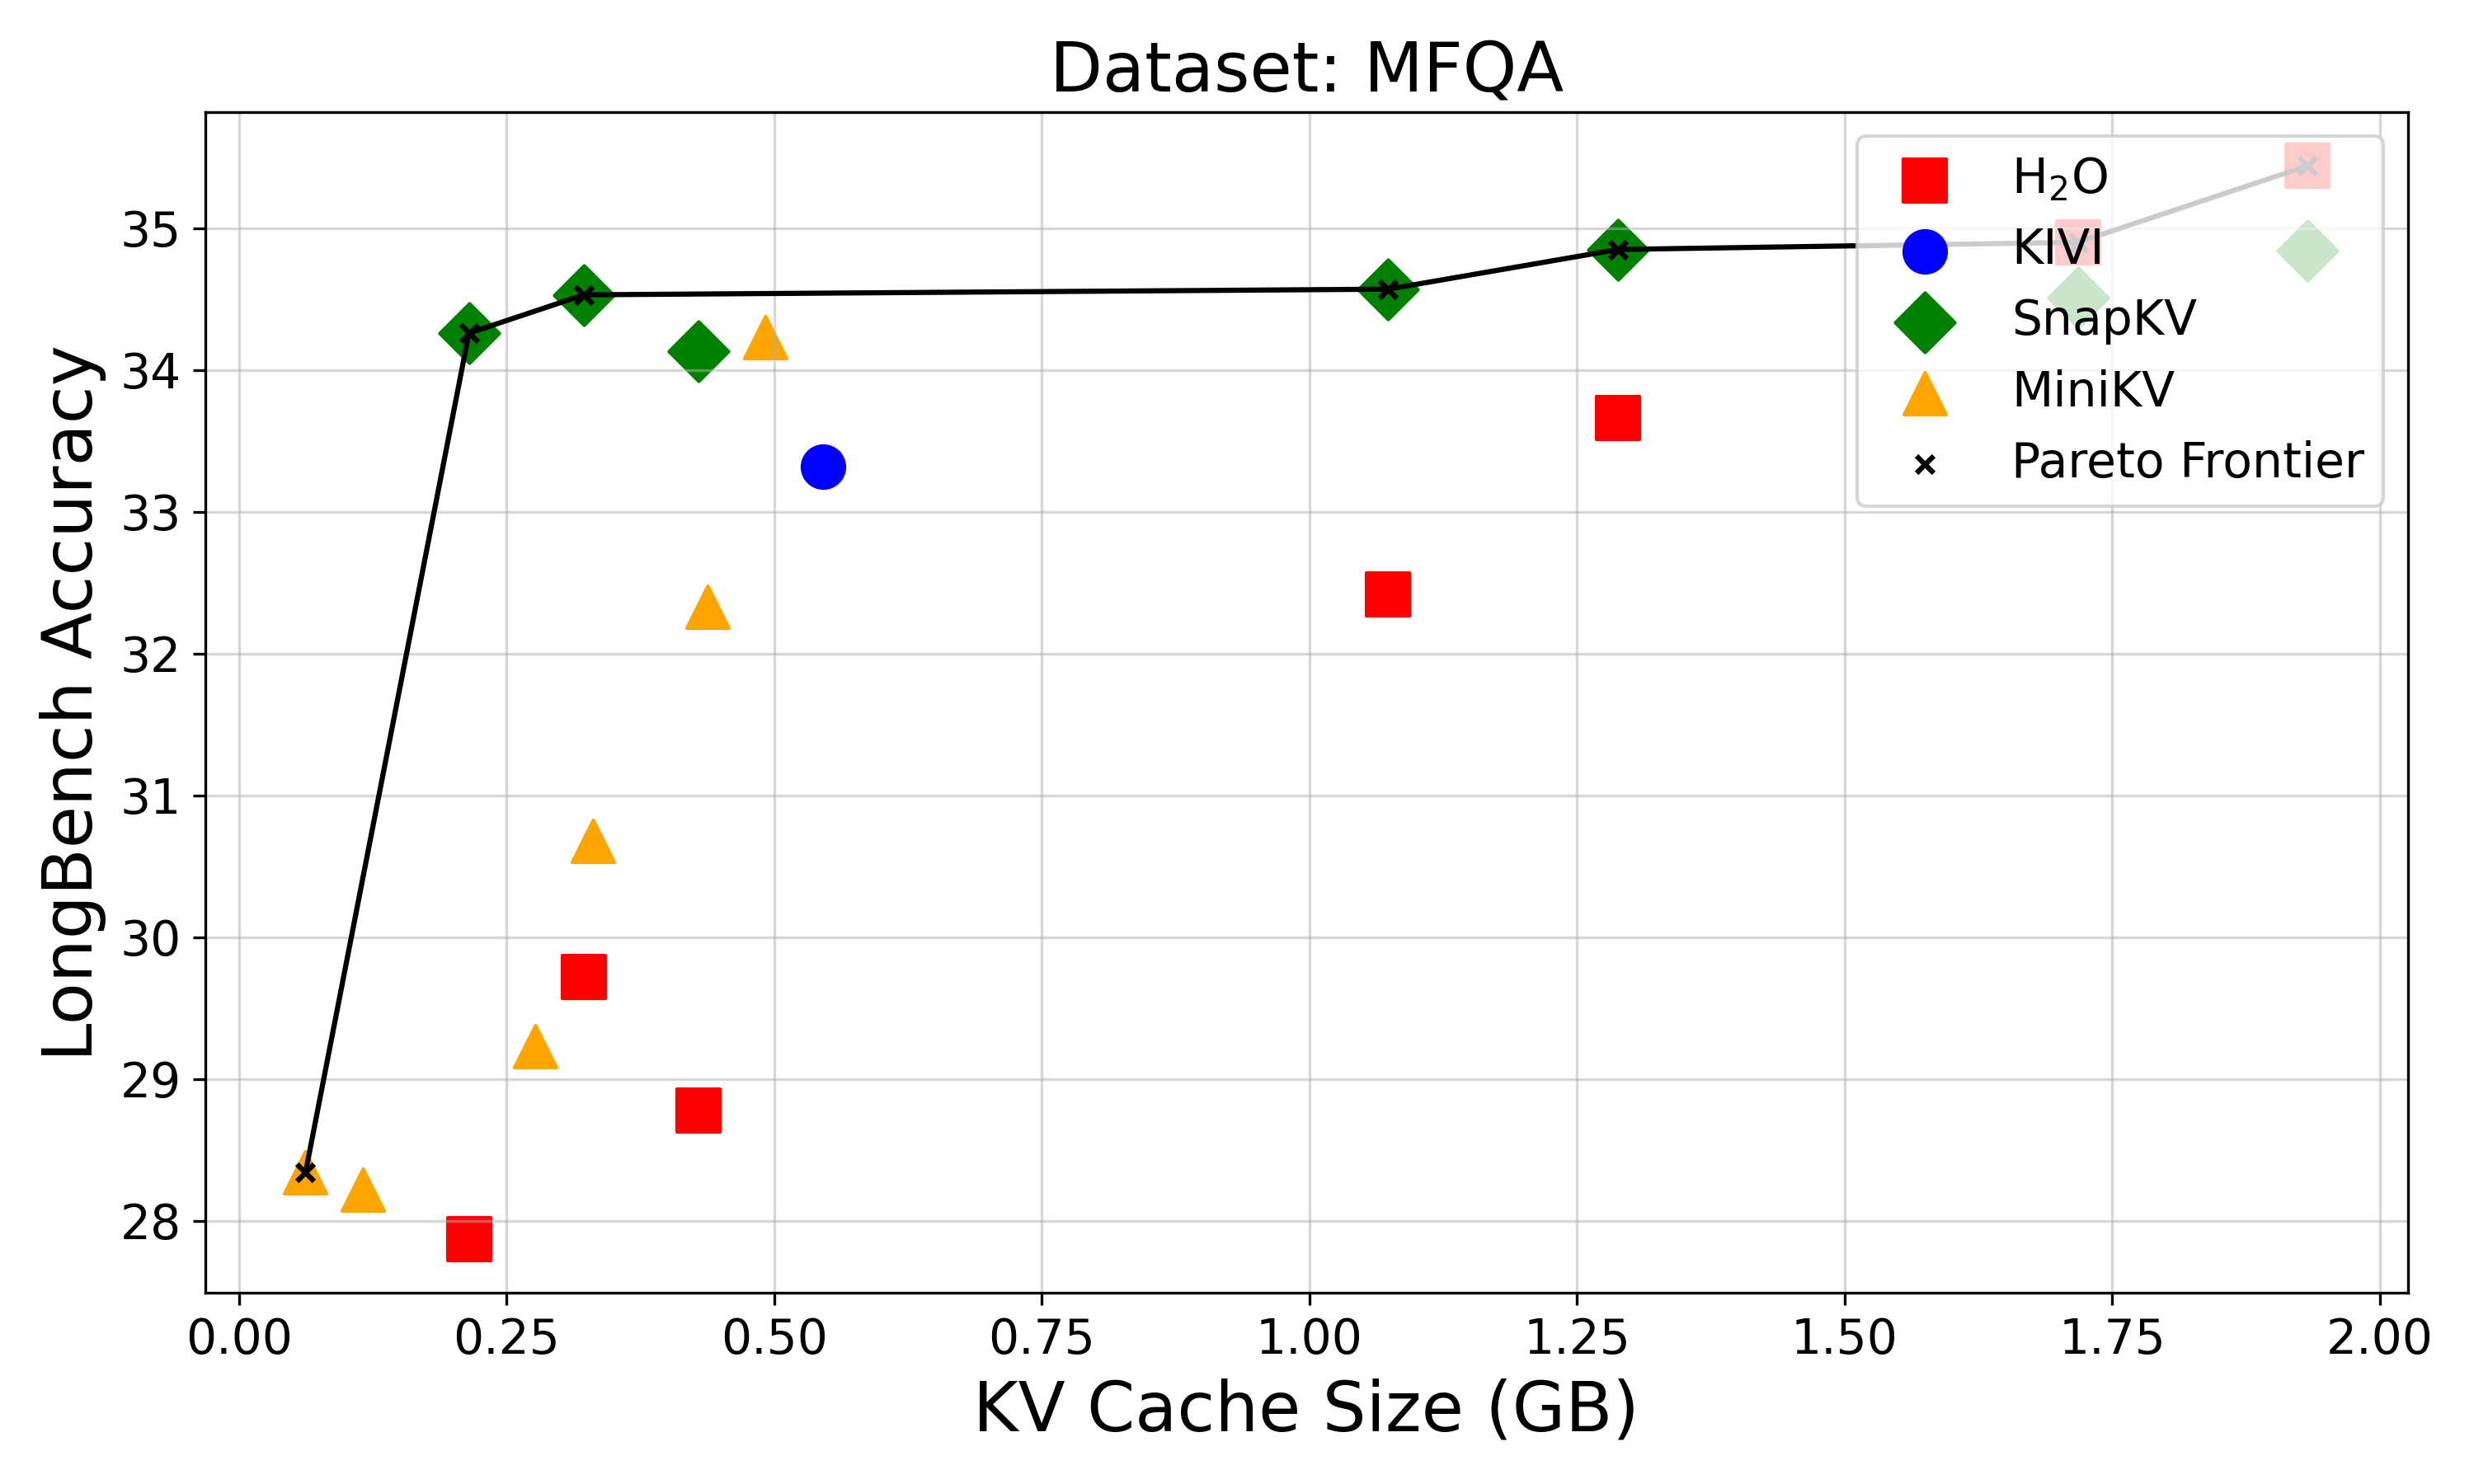
The chart visualizes the relationship between KV Cache Size (in GB) and LongBench Accuracy for five different systems (H2O, KIVI, SnapKV, MiniKV) and a Pareto Frontier curve. The Pareto Frontier represents the optimal trade-off between cache size and accuracy.
### Components/Axes
- **X-axis**: KV Cache Size (GB) ranging from 0.00 to 2.00 in 0.25 increments
- **Y-axis**: LongBench Accuracy (28–36) in 1-point increments
- **Legend**: Located in top-right corner with color-coded markers:
- Red squares: H2O
- Blue circle: KIVI
- Green diamonds: SnapKV
- Yellow triangles: MiniKV
- Black line with x markers: Pareto Frontier
### Detailed Analysis
1. **H2O (Red Squares)**:
- 0.25 GB: 28.0
- 0.5 GB: 29.0
- 1.0 GB: 32.5
- 1.25 GB: 33.7
- 2.0 GB: 35.5
2. **KIVI (Blue Circle)**:
- 0.5 GB: 33.4
3. **SnapKV (Green Diamonds)**:
- 0.125 GB: 34.2
- 0.25 GB: 34.5
- 0.5 GB: 34.1
- 1.0 GB: 34.6
- 1.25 GB: 34.9
- 2.0 GB: 35.2
4. **MiniKV (Yellow Triangles)**:
- 0.125 GB: 28.3
- 0.25 GB: 28.5
- 0.5 GB: 30.8
- 1.0 GB: 31.5
- 2.0 GB: 32.5
5. **Pareto Frontier (Black Line)**:
- Connects points from 28.2 (0.125 GB) to 35.8 (2.0 GB)
- Shows steady upward trend with minimal curvature
### Key Observations
- Pareto Frontier demonstrates optimal performance scaling with cache size
- H2O consistently underperforms other systems across all cache sizes
- KIVI only has one data point at 0.5 GB (33.4 accuracy)
- SnapKV maintains highest accuracy across all tested cache sizes
- MiniKV shows significant improvement from 0.5 GB to 2.0 GB (30.8 → 32.5)
- Pareto Frontier's 2.0 GB point (35.8) exceeds all individual system measurements
### Interpretation
The data suggests that larger KV cache sizes generally improve LongBench Accuracy, with the Pareto Frontier representing the theoretical maximum achievable performance. SnapKV demonstrates the most consistent high performance, while H2O lags behind other systems. The absence of KIVI data beyond 0.5 GB suggests either testing limitations or system-specific constraints. The Pareto Frontier's upward trend indicates that increasing cache size beyond 2.0 GB would likely yield further accuracy improvements, though diminishing returns may occur based on the curve's flattening pattern.