## Charts: Training Dynamics
### Overview
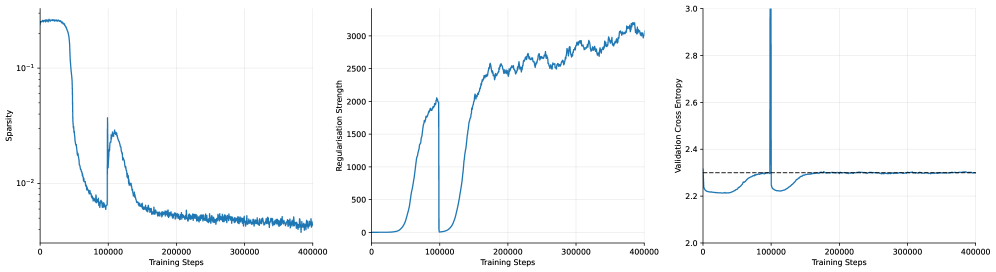
The image presents three line charts arranged horizontally, depicting the dynamics of a training process. The charts show the evolution of Sparsity, Regularisation Strength, and Validation Cross Entropy as a function of Training Steps. All three charts share the same x-axis (Training Steps) but have different y-axes and scales.
### Components/Axes
* **Chart 1 (Left):**
* X-axis: Training Steps (0 to 40000)
* Y-axis: Sparsity (Logarithmic scale, from 10^-1 to 10^-3)
* **Chart 2 (Center):**
* X-axis: Training Steps (0 to 40000)
* Y-axis: Regularisation Strength (0 to 3000)
* **Chart 3 (Right):**
* X-axis: Training Steps (0 to 40000)
* Y-axis: Validation Cross Entropy (2.2 to 3.0)
* All charts share the same x-axis label: "Training Steps".
* No legend is present. The single blue line in each chart represents the respective metric.
### Detailed Analysis or Content Details
**Chart 1: Sparsity vs. Training Steps**
The line representing Sparsity initially starts at approximately 0.1 (10^-1) and rapidly decreases to around 0.01 (10^-2) by approximately 10,000 training steps. It then plateaus and fluctuates around 0.005 (10^-2) to 0.01 (10^-2) for the remainder of the training process, up to 40,000 steps. There are some minor oscillations, but the overall trend is a decrease and then stabilization.
**Chart 2: Regularisation Strength vs. Training Steps**
The line representing Regularisation Strength starts at approximately 0 at 0 training steps. It increases relatively quickly to around 500 by 10,000 training steps. From 10,000 to 30,000 steps, it continues to increase, reaching approximately 2500. After 30,000 steps, the increase slows down, and the line fluctuates between 2500 and 3000, reaching a maximum of approximately 3100 at 40,000 steps. The overall trend is an increasing Regularisation Strength.
**Chart 3: Validation Cross Entropy vs. Training Steps**
The line representing Validation Cross Entropy begins at approximately 2.8 at 0 training steps. It exhibits a sharp decrease to around 2.2 by 10,000 training steps. Between 10,000 and 20,000 steps, it continues to decrease, reaching a minimum of approximately 2.15 at around 15,000 steps. After 20,000 steps, the line fluctuates around 2.2 to 2.3, with some minor oscillations, and remains relatively stable until 40,000 steps. There is a large spike at the beginning of the training process.
### Key Observations
* Sparsity decreases rapidly initially and then stabilizes.
* Regularisation Strength consistently increases throughout the training process.
* Validation Cross Entropy decreases initially and then plateaus, indicating potential convergence.
* The initial spike in Validation Cross Entropy suggests a period of instability or high error at the beginning of training.
* The stabilization of Validation Cross Entropy suggests the model is learning and generalizing well.
### Interpretation
The charts collectively illustrate the training dynamics of a model. The decreasing Sparsity suggests that the model is becoming less reliant on a large number of parameters, potentially leading to a more efficient representation. The increasing Regularisation Strength indicates that a penalty is being applied to complex models, preventing overfitting. The decreasing and then stabilizing Validation Cross Entropy suggests that the model is learning to generalize to unseen data.
The initial spike in Validation Cross Entropy could be due to random initialization or a learning rate that is initially too high. The subsequent decrease indicates that the model is adapting and improving its performance. The plateau in Validation Cross Entropy suggests that the model has reached a point of diminishing returns and further training may not significantly improve its performance.
The relationship between these metrics is crucial. The increasing Regularisation Strength likely contributes to the decreasing Sparsity and the stabilization of Validation Cross Entropy. By penalizing complex models, Regularisation encourages the model to find a simpler, more generalizable solution. The interplay between these factors is essential for achieving optimal model performance.