## Data Table: Operation Latency
### Overview
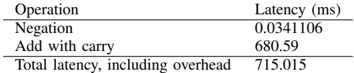
The image presents a data table showing the latency of different operations, measured in milliseconds (ms). The table includes the latency for "Negation", "Add with carry", and the "Total latency, including overhead".
### Components/Axes
* **Columns:**
* Operation
* Latency (ms)
* **Rows:**
* Negation
* Add with carry
* Total latency, including overhead
### Detailed Analysis or ### Content Details
| Operation | Latency (ms) |
| ------------------------------- | ------------ |
| Negation | 0.0341106 |
| Add with carry | 680.59 |
| Total latency, including overhead | 715.015 |
### Key Observations
* The "Add with carry" operation has a significantly higher latency (680.59 ms) compared to the "Negation" operation (0.0341106 ms).
* The "Total latency, including overhead" (715.015 ms) is greater than the "Add with carry" latency, indicating that the overhead and negation latency contribute to the total latency.
### Interpretation
The data suggests that the "Add with carry" operation is the most time-consuming operation in this context. The total latency is only slightly higher than the "Add with carry" latency, implying that the overhead and negation operations contribute a relatively small amount to the overall latency. The table highlights the performance bottleneck associated with the "Add with carry" operation.