## Line Chart: Problem Solving Performance Comparison
### Overview
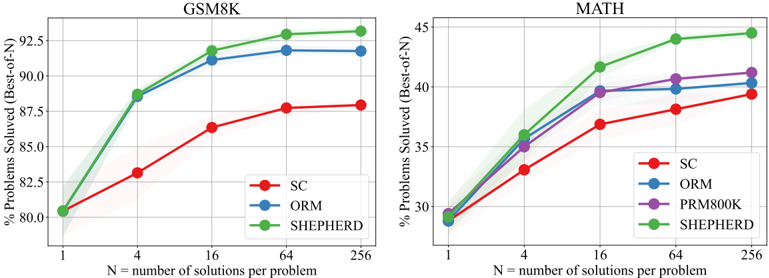
The image presents two line charts comparing the performance of different problem-solving methods (SC, ORM, PRM800K, and SHEPHERD) on two datasets: GSM8K and MATH. The charts display the percentage of problems solved (Best-of-N) as a function of the number of solutions generated per problem (N), ranging from 1 to 256.
### Components/Axes
* **X-axis (both charts):** "N = number of solutions per problem". Markers are at 1, 4, 16, 64, and 256.
* **Y-axis (left chart - GSM8K):** "% Problems Solved (Best-of-N)". Scale ranges from 80% to 92%, with increments of 2.5%.
* **Y-axis (right chart - MATH):** "% Problems Solved (Best-of-N)". Scale ranges from 25% to 45%, with increments of 5%.
* **Legend (bottom-left of each chart):**
* SC (Red)
* ORM (Blue)
* PRM800K (Purple)
* SHEPHERD (Green)
* **Titles:**
* Left Chart: "GSM8K" (top-center)
* Right Chart: "MATH" (top-center)
### Detailed Analysis or Content Details
**GSM8K Chart:**
* **SC (Red):** The line starts at approximately 80% at N=1, increases to around 87% at N=4, plateaus around 87.5% at N=16, and reaches approximately 88% at N=256. The trend is initially steep, then flattens.
* **ORM (Blue):** The line begins at approximately 87% at N=1, rises to around 91% at N=4, reaches a peak of approximately 92% at N=16, and remains relatively stable at around 91.5% at N=256. The trend is upward, with a plateau.
* **PRM800K (Purple):** The line starts at approximately 87% at N=1, increases to around 90% at N=4, reaches approximately 91.5% at N=16, and continues to rise to approximately 91.8% at N=256. The trend is consistently upward, but less steep than SC or ORM.
* **SHEPHERD (Green):** The line starts at approximately 88% at N=1, increases rapidly to around 92% at N=4, reaches approximately 92.5% at N=16, and continues to rise slightly to approximately 92.8% at N=256. This line consistently outperforms the others.
**MATH Chart:**
* **SC (Red):** The line starts at approximately 28% at N=1, increases to around 35% at N=4, rises to approximately 40% at N=16, reaches around 42% at N=64, and plateaus at approximately 42.5% at N=256.
* **ORM (Blue):** The line begins at approximately 30% at N=1, increases to around 37% at N=4, rises to approximately 40% at N=16, and remains relatively stable at around 40.5% at N=256.
* **PRM800K (Purple):** The line starts at approximately 30% at N=1, increases to around 36% at N=4, rises to approximately 40% at N=16, and continues to rise to approximately 41% at N=256.
* **SHEPHERD (Green):** The line starts at approximately 32% at N=1, increases rapidly to around 42% at N=4, rises to approximately 44% at N=16, reaches approximately 44.5% at N=64, and plateaus at approximately 44.8% at N=256. This line consistently outperforms the others.
### Key Observations
* **SHEPHERD consistently outperforms all other methods** on both datasets, especially at lower values of N.
* **The performance of all methods generally increases with N**, but the rate of increase diminishes as N grows larger.
* **The GSM8K dataset shows higher overall performance** compared to the MATH dataset, with all methods achieving higher percentages of problems solved.
* **SC shows the lowest performance** on both datasets.
* **The gap between SHEPHERD and other methods narrows** as N increases, suggesting diminishing returns.
### Interpretation
The data suggests that the SHEPHERD method is the most effective approach for solving problems in both the GSM8K and MATH datasets. Increasing the number of solutions generated (N) generally improves performance, but the benefits of generating more solutions decrease as N becomes larger. The difference in performance between the datasets indicates that the GSM8K problems are inherently easier to solve than the MATH problems. The consistent underperformance of SC suggests it is a less effective method compared to ORM, PRM800K, and especially SHEPHERD.
The charts demonstrate a clear trade-off between computational cost (generating more solutions) and problem-solving accuracy. While increasing N improves performance, the marginal gains diminish, suggesting an optimal point beyond which further computation yields limited benefits. The consistent superiority of SHEPHERD implies that its underlying approach is more robust and efficient at exploring the solution space, even with a limited number of attempts.