\n
## Line Charts: GSM8K and MATH Benchmark Performance
### Overview
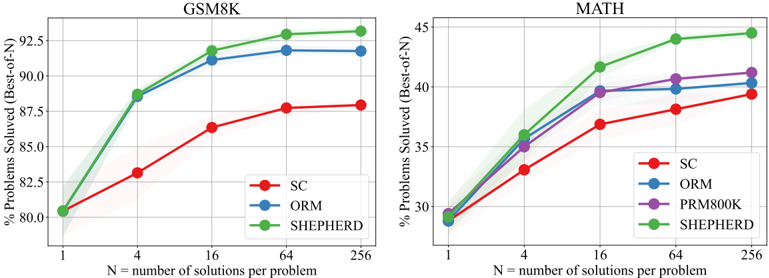
The image displays two side-by-side line charts comparing the performance of different methods on two mathematical reasoning benchmarks: GSM8K (left) and MATH (right). Both charts plot the percentage of problems solved against the number of solutions sampled per problem (N), using a "Best-of-N" evaluation metric. The charts demonstrate how performance scales with increased sampling for each method.
### Components/Axes
**Common Elements (Both Charts):**
* **X-Axis:** Labeled "N = number of solutions per problem". It uses a logarithmic scale with discrete markers at N = 1, 4, 16, 64, and 256.
* **Y-Axis:** Labeled "% Problems Solved (Best-of-N)". The scale is linear.
* **Legend:** Positioned in the bottom-right corner of each chart's plot area. It lists the methods with corresponding colored line and marker symbols.
* **Data Representation:** Each method is represented by a solid line connecting circular data points. A semi-transparent shaded band around each line likely indicates confidence intervals or variance.
**GSM8K Chart (Left):**
* **Title:** "GSM8K" (centered at the top).
* **Y-Axis Range:** Approximately 78% to 94%.
* **Legend Entries:**
* `SC` (Red line, red circle marker)
* `ORM` (Blue line, blue circle marker)
* `SHEPHERD` (Green line, green circle marker)
**MATH Chart (Right):**
* **Title:** "MATH" (centered at the top).
* **Y-Axis Range:** Approximately 28% to 45%.
* **Legend Entries:**
* `SC` (Red line, red circle marker)
* `ORM` (Blue line, blue circle marker)
* `PRM800K` (Purple line, purple circle marker)
* `SHEPHERD` (Green line, green circle marker)
### Detailed Analysis
**GSM8K Chart Data & Trends:**
* **Trend Verification:** All three lines show a clear upward trend that begins to plateau after N=64. The slope is steepest between N=1 and N=16.
* **Data Points (Approximate % Solved):**
* **N=1:** All methods start at nearly the same point, ~80.5%.
* **N=4:** SHEPHERD (Green) and ORM (Blue) rise sharply to ~88.5%. SC (Red) rises more slowly to ~83%.
* **N=16:** SHEPHERD leads at ~92%. ORM is close behind at ~91%. SC reaches ~86.5%.
* **N=64:** SHEPHERD ~93%. ORM ~92%. SC ~88%.
* **N=256:** SHEPHERD ~93.5%. ORM ~92%. SC ~88.2%. The gains from N=64 to N=256 are minimal for all methods.
**MATH Chart Data & Trends:**
* **Trend Verification:** All four lines show an upward trend that also begins to plateau, though the overall performance is significantly lower than on GSM8K. The initial slope (N=1 to N=16) is steep.
* **Data Points (Approximate % Solved):**
* **N=1:** All methods start clustered around 29%.
* **N=4:** SHEPHERD (Green) leads at ~36%. ORM (Blue) and PRM800K (Purple) are near ~35%. SC (Red) is lowest at ~33%.
* **N=16:** SHEPHERD ~41.5%. PRM800K ~39.5%. ORM ~39.5%. SC ~37%.
* **N=64:** SHEPHERD ~43.5%. PRM800K ~40.5%. ORM ~40%. SC ~38%.
* **N=256:** SHEPHERD ~44.5%. PRM800K ~41%. ORM ~40.5%. SC ~39.2%. The performance gap between SHEPHERD and the others widens slightly as N increases.
### Key Observations
1. **Consistent Hierarchy:** On both benchmarks, the `SHEPHERD` method (green) consistently achieves the highest performance at every value of N > 1. `SC` (red) consistently performs the worst.
2. **Dataset Difficulty:** The absolute performance on the MATH benchmark (y-axis max ~45%) is substantially lower than on GSM8K (y-axis max ~94%), indicating MATH is a more challenging dataset for all evaluated methods.
3. **Diminishing Returns:** For all methods on both tasks, the performance gain from increasing N shows clear diminishing returns. The most significant improvements occur when moving from N=1 to N=16. The curves flatten considerably between N=64 and N=256.
4. **Method Comparison:** `ORM` (blue) and `PRM800K` (purple, only on MATH) perform similarly, occupying a middle tier between SHEPHERD and SC. On MATH, PRM800K holds a very slight edge over ORM at higher N values.
5. **Starting Point Convergence:** At N=1 (single solution), all methods within each chart start at approximately the same performance level. The differentiation between methods emerges and grows as more solutions are sampled (N increases).
### Interpretation
The data suggests that the `SHEPHERD` method is more effective at leveraging increased sampling (higher N) to find correct solutions compared to `SC`, `ORM`, and `PRM800K`. Its superior scaling indicates it may have a better underlying strategy for generating or selecting among multiple candidate solutions.
The stark difference in overall scores between GSM8K and MATH highlights the increased complexity of the MATH dataset, which likely requires more advanced reasoning steps. The fact that all methods show similar scaling patterns (steep initial rise, then plateau) implies a fundamental limit to the "Best-of-N" sampling approach; simply generating more solutions yields progressively smaller benefits.
The close performance of `ORM` and `PRM800K` suggests these methods may share similar underlying mechanisms or limitations. The consistent underperformance of `SC` (likely "Self-Consistency") indicates that its approach to aggregating multiple solutions is less effective than the others tested in this evaluation setup.
**Language Declaration:** All text in the image is in English.