## Charts/Graphs: Current vs. Time and Program Current vs. Resistance
### Overview
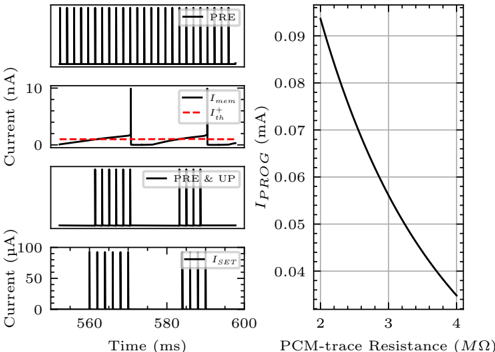
The image presents two distinct charts. The left side displays four time-series plots of current (in nA and µA) versus time (in milliseconds). The right side shows a single plot of program current (I_PROG, in mA) versus PCM-trace resistance (in MΩ). The left charts appear to illustrate different current profiles during a process labeled "PRE" and "UP", while the right chart shows the relationship between program current and resistance.
### Components/Axes
**Left Charts:**
* **X-axis:** Time (ms), ranging from approximately 560 ms to 600 ms.
* **Y-axis (Top & Third Charts):** Current (nA), ranging from 0 to approximately 10 nA.
* **Y-axis (Bottom Chart):** Current (µA), ranging from 0 to approximately 100 µA.
* **Legends:**
* "PRE" (Solid black line)
* "I_mem" (Solid black line)
* "I_th" (Dashed red line)
* "PRE & UP" (Solid black line)
* "I_SET" (Solid black line)
**Right Chart:**
* **X-axis:** PCM-trace Resistance (MΩ), ranging from approximately 2 MΩ to 4 MΩ.
* **Y-axis:** I_PROG (mA), ranging from approximately 0.04 mA to 0.09 mA.
### Detailed Analysis or Content Details
**Left Charts:**
* **Top Chart ("PRE"):** The "PRE" signal is a series of approximately equally spaced, short pulses. The pulses are roughly 0.5 ms wide and occur approximately every 1.5 ms. The amplitude of the pulses is around 5 nA.
* **Second Chart (I_mem & I_th):** "I_mem" starts at approximately 0 mA and gradually increases to around 2 nA by 600 ms. "I_th" remains relatively constant at approximately 0.5 nA until around 580 ms, then increases to approximately 1.5 nA by 600 ms.
* **Third Chart ("PRE & UP"):** This chart shows a similar pattern to the top chart ("PRE") for the first part, then transitions to a series of wider pulses with a higher amplitude. The pulses are approximately 2 ms wide and occur approximately every 3 ms. The amplitude of these pulses is around 5 nA.
* **Bottom Chart ("I_SET"):** The "I_SET" signal consists of a series of short, high-amplitude pulses. The pulses are approximately 0.5 ms wide and occur approximately every 1.5 ms. The amplitude of the pulses is around 80 µA.
**Right Chart (I_PROG vs. PCM-trace Resistance):**
* The line slopes downward, indicating an inverse relationship between program current and PCM-trace resistance.
* At approximately 2 MΩ resistance, the program current is approximately 0.09 mA.
* At approximately 4 MΩ resistance, the program current is approximately 0.04 mA.
* The relationship appears approximately linear.
### Key Observations
* The left charts show different current profiles associated with "PRE", "UP", and "SET" operations.
* The "PRE" signal appears to be a series of small pulses.
* The "PRE & UP" signal combines the "PRE" pulses with larger pulses, suggesting a transition or change in state.
* The "I_SET" signal is characterized by high-amplitude pulses.
* The right chart demonstrates that as the PCM-trace resistance increases, the required program current decreases.
### Interpretation
The data suggests a process involving phase-change memory (PCM) where different current profiles are used to control the state of the memory cell. The "PRE" signal likely prepares the cell for a change, while the "UP" signal initiates the change. The "I_SET" signal is used to set the cell to a specific resistance state. The right chart shows the relationship between the program current and the resulting resistance of the PCM trace. The inverse relationship indicates that higher resistance requires lower program current, and vice versa. This is consistent with the physics of PCM, where higher resistance corresponds to an amorphous state and lower resistance to a crystalline state. The "I_mem" and "I_th" curves likely represent the memory current and threshold current, respectively, and their gradual increase suggests a change in the cell's properties over time. The combination of these signals and their relationship to resistance provides insight into the control and operation of a PCM device.