## Scatter Plot: Factual vs. Hallucinated Associations
### Overview
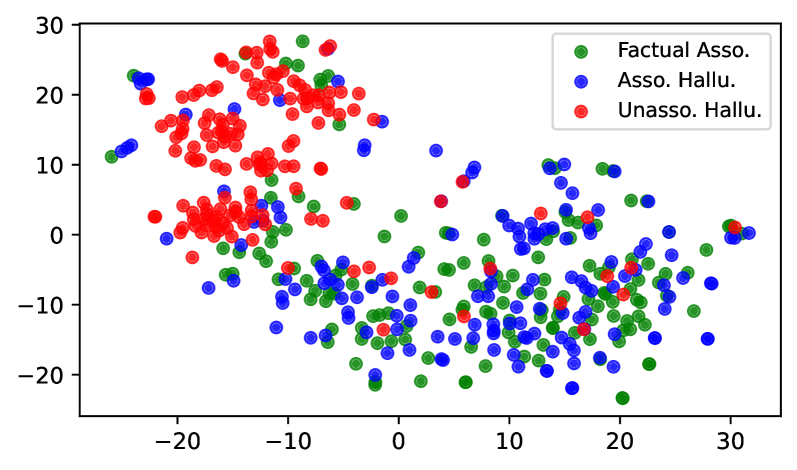
The image is a scatter plot visualizing the distribution of three categories: "Factual Asso.", "Asso. Hallu.", and "Unasso. Hallu." The plot displays data points in a two-dimensional space, with the x and y axes ranging from approximately -25 to 30. The data points are color-coded: green for "Factual Asso.", blue for "Asso. Hallu.", and red for "Unasso. Hallu.". The plot shows the relative positioning and clustering of these three categories.
### Components/Axes
* **X-axis:** Ranges from approximately -25 to 30, with no explicit label.
* **Y-axis:** Ranges from -20 to 30, with no explicit label.
* **Legend (Top-Right):**
* Green: "Factual Asso."
* Blue: "Asso. Hallu."
* Red: "Unasso. Hallu."
### Detailed Analysis
* **Factual Asso. (Green):**
* Data points are scattered across the plot, with a higher concentration in the top-left quadrant (x: -25 to 0, y: 0 to 30) and the bottom-right quadrant (x: 0 to 30, y: -20 to 0).
* Specific data points: (-15, 28), (25, -15), (-5, -15)
* **Asso. Hallu. (Blue):**
* Data points are primarily clustered in the bottom-right quadrant (x: 0 to 30, y: -20 to 10).
* Specific data points: (10, -10), (20, 0), (5, -20)
* **Unasso. Hallu. (Red):**
* Data points are concentrated in the top-left quadrant (x: -25 to 0, y: 0 to 30).
* Specific data points: (-15, 15), (-5, 20), (-20, 5)
### Key Observations
* "Unasso. Hallu." (red) is primarily located in the top-left.
* "Asso. Hallu." (blue) is primarily located in the bottom-right.
* "Factual Asso." (green) is more dispersed, appearing in both the top-left and bottom-right.
* There is some overlap between all three categories, indicating that the separation is not absolute.
### Interpretation
The scatter plot visualizes the relationships between factual associations and two types of hallucinations ("Asso. Hallu." and "Unasso. Hallu."). The clustering suggests that "Unasso. Hallu." and "Asso. Hallu." tend to occupy different regions in the feature space represented by the x and y axes. "Factual Asso." appears to be more broadly distributed, potentially indicating that it shares characteristics with both types of hallucinations or that it represents a more diverse set of associations. The overlap between the categories suggests that the distinction between factual associations and hallucinations is not always clear-cut, and there may be cases where they are difficult to differentiate based on the features used to generate this plot. The axes are not labeled, so the specific features being visualized are unknown.