TECHNICAL ASSET FINGERPRINT
e5e303b2563c3dcf56a253f8
Click to view fullscreen
Press ESC or click to close
FOUND IN PAPERS
EXPERT: healer-alpha-free VERSION 1
RUNTIME: free/openrouter/healer-alpha
INTEL_VERIFIED
## Heatmap: Cross-Dataset Correlation Analysis
### Overview
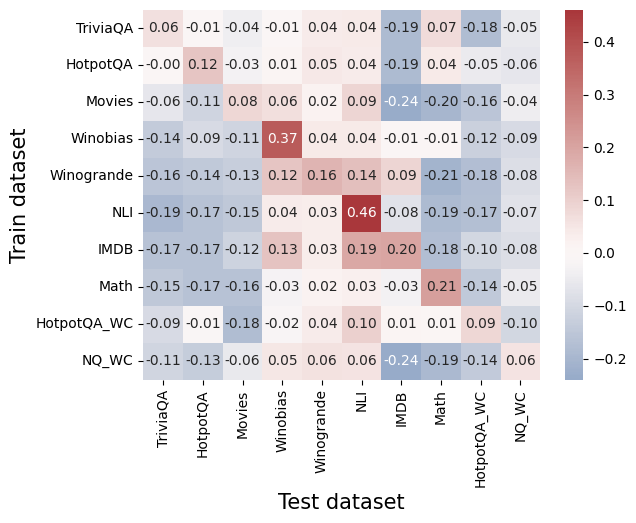
The image is a heatmap visualizing the correlation coefficients between machine learning models trained on various datasets (y-axis) and evaluated on different test datasets (x-axis). The chart uses a diverging color scale to represent the strength and direction of correlation, with red indicating positive correlation, blue indicating negative correlation, and white/light colors indicating values near zero.
### Components/Axes
* **Y-Axis (Vertical):** Labeled "Train dataset". It lists 10 training datasets from top to bottom:
1. TriviaQA
2. HotpotQA
3. Movies
4. Winobias
5. Winogrande
6. NLI
7. IMDB
8. Math
9. HotpotQA_WC
10. NQ_WC
* **X-Axis (Horizontal):** Labeled "Test dataset". It lists 10 test datasets from left to right, in the same order as the y-axis:
1. TriviaQA
2. HotpotQA
3. Movies
4. Winobias
5. Winogrande
6. NLI
7. IMDB
8. Math
9. HotpotQA_WC
10. NQ_WC
* **Color Bar/Legend:** Positioned on the right side of the chart. It is a vertical gradient bar mapping color to correlation values.
* **Scale:** Ranges from approximately -0.2 (dark blue) to +0.4 (dark red).
* **Key Markers:** -0.2, -0.1, 0.0, 0.1, 0.2, 0.3, 0.4.
* **Data Grid:** A 10x10 grid of colored cells. Each cell contains a numerical correlation value printed in black text. The cell's color corresponds to the value according to the color bar.
### Detailed Analysis
The following table reconstructs the correlation matrix. Values are transcribed directly from the cells. The diagonal (where Train dataset = Test dataset) is highlighted in **bold** as it represents the in-domain performance correlation.
| Train \ Test | TriviaQA | HotpotQA | Movies | Winobias | Winogrande | NLI | IMDB | Math | HotpotQA_WC | NQ_WC |
| :--- | :--- | :--- | :--- | :--- | :--- | :--- | :--- | :--- | :--- | :--- |
| **TriviaQA** | **0.06** | -0.01 | -0.04 | -0.01 | 0.04 | 0.04 | -0.19 | 0.07 | -0.18 | -0.05 |
| **HotpotQA** | -0.00 | **0.12** | -0.03 | 0.01 | 0.05 | 0.04 | -0.19 | 0.04 | -0.05 | -0.06 |
| **Movies** | -0.06 | -0.11 | **0.08** | 0.06 | 0.02 | 0.09 | -0.24 | -0.20 | -0.16 | -0.04 |
| **Winobias** | -0.14 | -0.09 | -0.11 | **0.37** | 0.04 | 0.04 | -0.01 | -0.01 | -0.12 | -0.09 |
| **Winogrande** | -0.16 | -0.14 | -0.13 | 0.12 | **0.16** | 0.14 | 0.09 | -0.21 | -0.18 | -0.08 |
| **NLI** | -0.19 | -0.17 | -0.15 | 0.04 | 0.03 | **0.46** | -0.08 | -0.19 | -0.17 | -0.07 |
| **IMDB** | -0.17 | -0.17 | -0.12 | 0.13 | 0.03 | 0.19 | **0.20** | -0.18 | -0.10 | -0.08 |
| **Math** | -0.15 | -0.17 | -0.16 | -0.03 | 0.02 | 0.03 | -0.03 | **0.21** | -0.14 | -0.05 |
| **HotpotQA_WC** | -0.09 | -0.01 | -0.18 | -0.02 | 0.04 | 0.10 | 0.01 | 0.01 | **0.09** | -0.10 |
| **NQ_WC** | -0.11 | -0.13 | -0.06 | 0.05 | 0.06 | 0.06 | -0.24 | -0.19 | -0.14 | **0.06** |
**Trend Verification by Row (Train Dataset):**
* **TriviaQA:** Mostly weak negative correlations with other test sets, strongest negative with IMDB (-0.19).
* **HotpotQA:** Weak correlations overall, slightly positive with itself (0.12).
* **Movies:** Strong negative correlation with IMDB (-0.24) and Math (-0.20).
* **Winobias:** Shows a strong positive correlation with itself (0.37). Weak to moderate positive with a few others (e.g., Winogrande 0.12).
* **Winogrande:** Positive correlation with itself (0.16) and NLI (0.14). Negative with Math (-0.21).
* **NLI:** Shows the strongest single correlation in the chart with itself (0.46). Generally weak negative or near-zero correlations elsewhere.
* **IMDB:** Positive correlation with itself (0.20) and NLI (0.19). Negative with Movies (-0.12) and others.
* **Math:** Strong positive correlation with itself (0.21). Generally negative correlations with other datasets.
* **HotpotQA_WC:** Weak correlations overall, slightly positive with itself (0.09) and NLI (0.10).
* **NQ_WC:** Weak correlations, slightly positive with itself (0.06) and Winobias (0.05). Strong negative with IMDB (-0.24).
### Key Observations
1. **Diagonal Dominance:** The highest correlation for most rows is on the diagonal (same train and test dataset), indicating models perform best when tested on data from the same distribution they were trained on. The exceptions are TriviaQA and HotpotQA_WC, where their diagonal values are not the highest in their row.
2. **Strongest Positive Correlation:** The cell at the intersection of **Train: NLI** and **Test: NLI** has the highest value in the entire chart: **0.46**.
3. **Strongest Negative Correlation:** The cell at **Train: Movies** and **Test: IMDB** has the most negative value: **-0.24**. The cell at **Train: NQ_WC** and **Test: IMDB** also shows -0.24.
4. **Dataset Clusters:**
* **NLI & Winobias/Winogrande:** Models trained on NLI show a mild positive correlation with Winobias (0.04) and Winogrande (0.03) test sets. Conversely, Winobias-trained models show a mild positive correlation with the NLI test set (0.04).
* **IMDB & Movies:** There is a notable negative relationship. Models trained on Movies perform poorly on IMDB tests (-0.24), and models trained on IMDB perform poorly on Movies tests (-0.12).
5. **General Trend:** Most off-diagonal correlations are weak (between -0.2 and +0.2), suggesting that performance on one dataset is not a strong predictor of performance on a different dataset for most pairs.
### Interpretation
This heatmap provides a diagnostic view of **transfer learning** or **cross-domain generalization** between different natural language processing and reasoning tasks.
* **What it demonstrates:** The data suggests that most of these datasets represent distinct tasks or distributions. A model's proficiency in one area (e.g., NLI) does not reliably translate to proficiency in another (e.g., Math or Movies). The strong diagonal values confirm that models are highly specialized to their training distribution.
* **Relationships between elements:** The chart reveals hidden relationships. For instance, the positive correlation between NLI and Winogrande/Winobias might indicate that these tasks share underlying skills like commonsense reasoning or linguistic understanding. The negative correlation between Movies and IMDB is surprising, as both are text classification tasks related to sentiment; it might suggest that the features or biases learned from one movie review dataset are actively detrimental to performance on the other, possibly due to differing domains (e.g., product reviews vs. movie reviews) or label definitions.
* **Notable Anomalies:** The fact that `TriviaQA` and `HotpotQA_WC` do not have their highest correlation on the diagonal is an anomaly. For `TriviaQA`, the highest value in its row is 0.07 (with Math test set). For `HotpotQA_WC`, the highest is 0.10 (with NLI test set). This could indicate noise in the data, a measurement artifact, or that these models generalize in unexpected ways.
* **Peircean Investigation:** The chart is an **index** of model performance relationships. It points directly to the fact that task similarity is not always intuitive. It is a **symbol** of the challenge in creating general-purpose AI, as expertise is often compartmentalized. The pattern invites further **abductive reasoning**: Why do NLI models transfer somewhat to Winogrande? Why do Movies and IMDB models negatively transfer? The answers likely lie in the underlying linguistic and semantic structures of the datasets themselves.
DECODING INTELLIGENCE...