TECHNICAL ASSET FINGERPRINT
e5ed896aec9ed99209def640
Click to view fullscreen
Press ESC or click to close
FOUND IN PAPERS
EXPERT: healer-alpha-free VERSION 1
RUNTIME: free/openrouter/healer-alpha
INTEL_VERIFIED
## Bar Chart Grid: AI Model Hallucination Analysis Across Benchmarks
### Overview
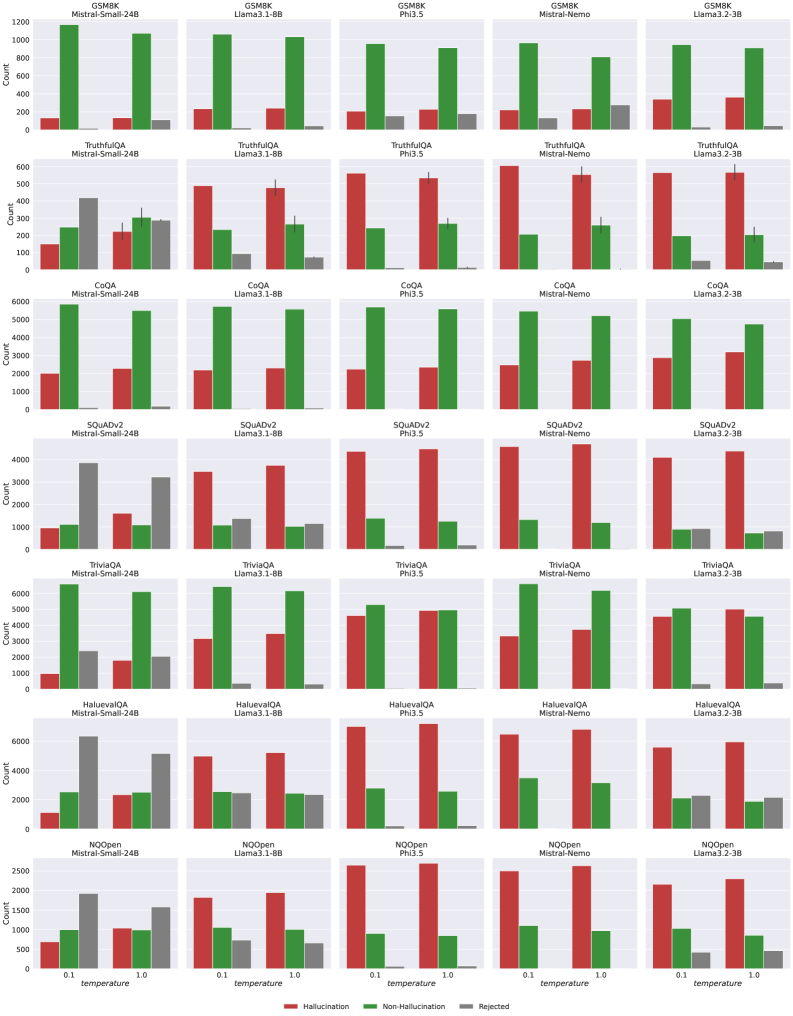
The image displays a 7x5 grid of grouped bar charts. Each chart compares the performance of five different Large Language Models (LLMs) on a specific benchmark dataset. The performance is measured across three categories: Hallucination, Non-Hallucination, and Rejected responses, at two different temperature settings (0.1 and 1.0). The overall purpose is to analyze and compare the propensity of different models to produce hallucinations versus correct or rejected answers across various tasks.
### Components/Axes
* **Grid Structure:**
* **Rows (7):** Each row corresponds to a specific benchmark dataset. From top to bottom: `GSM8K`, `TruthfulQA`, `CoQA`, `SQuADv2`, `TriviaQA`, `HaluevaQA`, `NQOpen`.
* **Columns (5):** Each column corresponds to a specific LLM. From left to right: `Mistral-Small-24B`, `Llama3.1-8B`, `Phi3.5`, `Mistral-Nemo`, `Llama3.2-3B`.
* **Individual Chart Axes:**
* **X-axis:** Labeled `temperature`. Two categorical markers: `0.1` and `1.0`.
* **Y-axis:** Labeled `Count`. The scale varies per benchmark row (e.g., 0-1200 for GSM8K, 0-6000 for CoQA).
* **Legend:** Located at the bottom center of the entire grid.
* **Red Bar:** `Hallucination`
* **Green Bar:** `Non-Hallucination`
* **Gray Bar:** `Rejected`
### Detailed Analysis
**Row 1: GSM8K (Mathematical Reasoning)**
* **Trend:** For all models, the green bar (Non-Hallucination) is dominant at both temperatures. The red bar (Hallucination) is very low. The gray bar (Rejected) is minimal.
* **Data Points (Approximate):**
* **Mistral-Small-24B:** Temp 0.1: Hallucination ~150, Non-Hallucination ~1150, Rejected ~50. Temp 1.0: Hallucination ~150, Non-Hallucination ~1100, Rejected ~100.
* **Llama3.1-8B:** Temp 0.1: Hallucination ~200, Non-Hallucination ~1100, Rejected ~50. Temp 1.0: Hallucination ~250, Non-Hallucination ~1050, Rejected ~50.
* **Phi3.5:** Temp 0.1: Hallucination ~200, Non-Hallucination ~950, Rejected ~150. Temp 1.0: Hallucination ~200, Non-Hallucination ~900, Rejected ~150.
* **Mistral-Nemo:** Temp 0.1: Hallucination ~200, Non-Hallucination ~950, Rejected ~100. Temp 1.0: Hallucination ~200, Non-Hallucination ~800, Rejected ~250.
* **Llama3.2-3B:** Temp 0.1: Hallucination ~300, Non-Hallucination ~950, Rejected ~50. Temp 1.0: Hallucination ~300, Non-Hallucination ~900, Rejected ~50.
**Row 2: TruthfulQA (Truthfulness)**
* **Trend:** The red bar (Hallucination) is the tallest for most models, especially at Temp 1.0. The green bar (Non-Hallucination) is secondary. The gray bar (Rejected) is significant for Mistral-Small-24B.
* **Data Points (Approximate):**
* **Mistral-Small-24B:** Temp 0.1: Hallucination ~150, Non-Hallucination ~250, Rejected ~400. Temp 1.0: Hallucination ~200, Non-Hallucination ~300, Rejected ~300.
* **Llama3.1-8B:** Temp 0.1: Hallucination ~500, Non-Hallucination ~250, Rejected ~100. Temp 1.0: Hallucination ~500, Non-Hallucination ~250, Rejected ~50.
* **Phi3.5:** Temp 0.1: Hallucination ~550, Non-Hallucination ~250, Rejected ~50. Temp 1.0: Hallucination ~550, Non-Hallucination ~250, Rejected ~50.
* **Mistral-Nemo:** Temp 0.1: Hallucination ~600, Non-Hallucination ~200, Rejected ~50. Temp 1.0: Hallucination ~550, Non-Hallucination ~250, Rejected ~50.
* **Llama3.2-3B:** Temp 0.1: Hallucination ~550, Non-Hallucination ~200, Rejected ~50. Temp 1.0: Hallucination ~550, Non-Hallucination ~200, Rejected ~50.
**Row 3: CoQA (Conversational QA)**
* **Trend:** The green bar (Non-Hallucination) is overwhelmingly dominant for all models at both temperatures. Red and gray bars are very low.
* **Data Points (Approximate):** All models show Non-Hallucination counts between ~5000-6000, with Hallucination and Rejected counts generally below 2000.
**Row 4: SQuADv2 (Reading Comprehension)**
* **Trend:** For Mistral-Small-24B, the gray bar (Rejected) is dominant. For all other models, the red bar (Hallucination) is dominant, especially at Temp 1.0. The green bar (Non-Hallucination) is consistently low.
* **Data Points (Approximate):**
* **Mistral-Small-24B:** Temp 0.1: Hallucination ~1000, Non-Hallucination ~1000, Rejected ~3800. Temp 1.0: Hallucination ~1500, Non-Hallucination ~1000, Rejected ~3000.
* **Other Models:** Hallucination counts range from ~3500-4500, Non-Hallucination ~1000-1500, Rejected ~500-1500.
**Row 5: TriviaQA (Factoid QA)**
* **Trend:** Similar to CoQA, the green bar (Non-Hallucination) is dominant for most models. Hallucination counts are moderate. Rejected counts are low.
* **Data Points (Approximate):** Non-Hallucination counts are generally between ~5000-6500. Hallucination counts range from ~1000-5000, with Phi3.5 and Llama3.2-3B showing higher hallucination rates.
**Row 6: HaluevaQA (Hallucination Evaluation)**
* **Trend:** This benchmark shows high red bars (Hallucination) for all models, particularly Phi3.5 and Mistral-Nemo. The green bar (Non-Hallucination) is secondary. The gray bar (Rejected) is notable for Mistral-Small-24B.
* **Data Points (Approximate):** Hallucination counts for Phi3.5 and Mistral-Nemo exceed 6000 at Temp 1.0. Other models range from ~2000-5500.
**Row 7: NQOpen (Open-Domain QA)**
* **Trend:** The red bar (Hallucination) is dominant for all models, especially at Temp 1.0. The green bar (Non-Hallucination) is secondary. The gray bar (Rejected) is low.
* **Data Points (Approximate):** Hallucination counts range from ~1500-2500. Non-Hallucination counts range from ~500-1000.
### Key Observations
1. **Benchmark Sensitivity:** Model behavior varies dramatically by benchmark. Models perform well (high Non-Hallucination) on CoQA and TriviaQA but struggle (high Hallucination) on TruthfulQA, HaluevaQA, and NQOpen.
2. **Temperature Effect:** Increasing temperature from 0.1 to 1.0 generally leads to an increase in the Hallucination count (red bar) and often a decrease in the Non-Hallucination count (green bar), suggesting higher randomness increases factual errors.
3. **Model Comparison:** No single model is best across all benchmarks. `Mistral-Small-24B` shows a unique pattern with high Rejected counts on TruthfulQA and SQuADv2. `Phi3.5` and `Mistral-Nemo` often show the highest Hallucination counts on challenging benchmarks like HaluevaQA.
4. **SQuADv2 Anomaly:** This is the only benchmark where the `Rejected` category (gray) is dominant for one model (`Mistral-Small-24B`), indicating a specific failure mode for that model on this task.
### Interpretation
This grid provides a multifaceted view of LLM reliability. The data suggests that:
* **Hallucination is task-dependent:** A model's tendency to hallucinate is not an intrinsic constant but is heavily influenced by the nature of the task (benchmark). Mathematical reasoning (GSM8K) and conversational QA (CoQA) elicit fewer hallucinations than truthfulness evaluation (TruthfulQA) or open-domain QA (NQOpen).
* **Temperature is a risk factor:** Higher temperature settings, while potentially increasing creativity or diversity, come at the cost of increased factual unreliability (hallucinations) across nearly all models and tasks.
* **Model Architecture/Training Matters:** The distinct profiles of models like `Mistral-Small-24B` (high rejections) versus `Phi3.5` (high hallucinations) imply different underlying training objectives or safety alignment strategies. The former may be more conservative, refusing to answer, while the latter is more confident but prone to error.
* **Benchmark Design is Crucial:** The starkly different results across rows highlight that evaluating an LLM on a single benchmark is insufficient. A comprehensive assessment requires a suite of tests targeting different capabilities and failure modes, as done here with benchmarks specifically designed to probe for hallucinations (HaluevaQA, TruthfulQA).
**Language Note:** All text in the image is in English.
DECODING INTELLIGENCE...