## Bar Chart: Prediction Flip Rate Comparison for Llama Models
### Overview
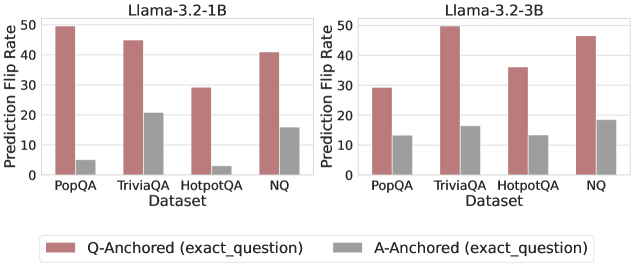
The image presents two bar charts comparing the prediction flip rates of two Llama models (Llama-3.2-1B and Llama-3.2-3B) across four different datasets: PopQA, TriviaQA, HotpotQA, and NQ. The charts show the prediction flip rates when using Q-Anchored (exact_question) and A-Anchored (exact_question) methods.
### Components/Axes
* **Titles:**
* Left Chart: Llama-3.2-1B
* Right Chart: Llama-3.2-3B
* **Y-axis:** Prediction Flip Rate, with a scale from 0 to 50. Axis markers are present at intervals of 10 (0, 10, 20, 30, 40, 50).
* **X-axis:** Dataset, with four categories: PopQA, TriviaQA, HotpotQA, NQ.
* **Legend:** Located at the bottom of the image.
* Q-Anchored (exact\_question): Represented by a muted red/brown color.
* A-Anchored (exact\_question): Represented by a gray color.
### Detailed Analysis
**Left Chart: Llama-3.2-1B**
* **PopQA:**
* Q-Anchored: Approximately 49
* A-Anchored: Approximately 5
* **TriviaQA:**
* Q-Anchored: Approximately 45
* A-Anchored: Approximately 21
* **HotpotQA:**
* Q-Anchored: Approximately 29
* A-Anchored: Approximately 3
* **NQ:**
* Q-Anchored: Approximately 41
* A-Anchored: Approximately 17
**Right Chart: Llama-3.2-3B**
* **PopQA:**
* Q-Anchored: Approximately 29
* A-Anchored: Approximately 13
* **TriviaQA:**
* Q-Anchored: Approximately 49
* A-Anchored: Approximately 16
* **HotpotQA:**
* Q-Anchored: Approximately 34
* A-Anchored: Approximately 13
* **NQ:**
* Q-Anchored: Approximately 47
* A-Anchored: Approximately 18
### Key Observations
* For both Llama models, the Q-Anchored method generally results in a higher prediction flip rate compared to the A-Anchored method across all datasets.
* The TriviaQA dataset shows the highest prediction flip rate for the Q-Anchored method in the Llama-3.2-3B model.
* The A-Anchored method consistently shows lower prediction flip rates, generally below 25 for all datasets and both models.
* The Llama-3.2-1B model has a higher Q-Anchored prediction flip rate for PopQA compared to Llama-3.2-3B.
### Interpretation
The data suggests that anchoring the question (Q-Anchored) leads to a higher likelihood of prediction flips compared to anchoring the answer (A-Anchored) for both Llama models. This could indicate that the models are more sensitive to variations or nuances in the question phrasing. The differences in prediction flip rates between the datasets may reflect the varying complexities and structures of the questions within each dataset. The Llama-3.2-1B model appears to be more sensitive to the question when using the PopQA dataset, as indicated by the higher Q-Anchored prediction flip rate compared to the Llama-3.2-3B model. The lower flip rates associated with A-Anchored suggest that the models are more stable when the answer is the anchor, possibly because the answer provides a more constrained context.