## Bar Chart: Average Performance Comparison
### Overview
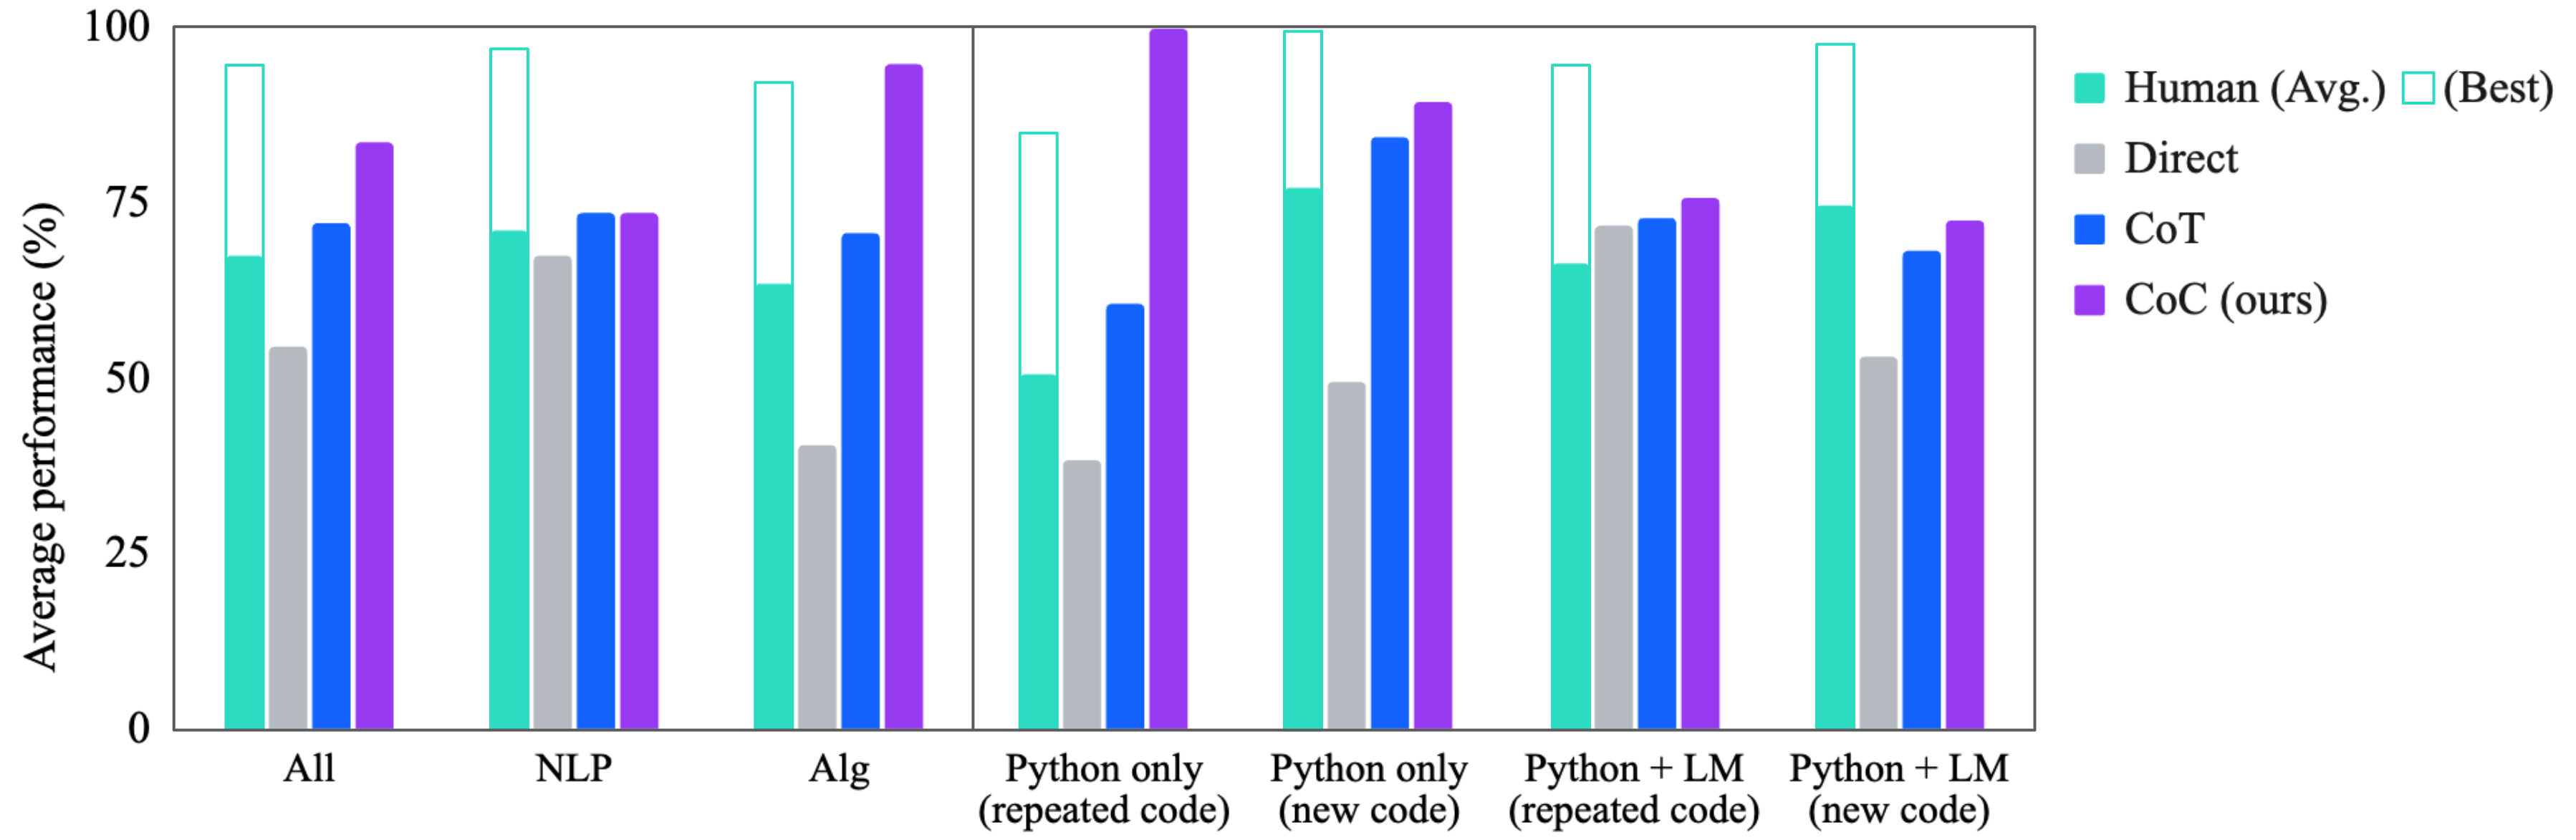
The image is a bar chart comparing the average performance (%) of different methods (Human, Direct, CoT, CoC) across various tasks: All, NLP, Alg, Python only (repeated code), Python only (new code), Python + LM (repeated code), and Python + LM (new code). The y-axis represents the average performance in percentage, ranging from 0 to 100. The x-axis represents the different tasks.
### Components/Axes
* **Y-axis:** "Average performance (%)", with scale markers at 0, 25, 50, 75, and 100.
* **X-axis:** Categorical axis representing different tasks: All, NLP, Alg, Python only (repeated code), Python only (new code), Python + LM (repeated code), Python + LM (new code).
* **Legend (Top-Right):**
* Human (Avg.): Teal bar
* Human (Best): White outline on Teal bar
* Direct: Gray bar
* CoT: Blue bar
* CoC (ours): Purple bar
### Detailed Analysis
**1. All Tasks:**
* Human (Avg.): ~67%
* Human (Best): ~93%
* Direct: ~53%
* CoT: ~72%
* CoC (ours): ~81%
**2. NLP Tasks:**
* Human (Avg.): ~73%
* Human (Best): ~95%
* Direct: ~67%
* CoT: ~73%
* CoC (ours): ~80%
**3. Alg Tasks:**
* Human (Avg.): ~65%
* Human (Best): ~92%
* Direct: ~40%
* CoT: ~69%
* CoC (ours): ~95%
**4. Python only (repeated code):**
* Human (Avg.): ~50%
* Human (Best): ~85%
* Direct: ~38%
* CoT: ~58%
* CoC (ours): ~100%
**5. Python only (new code):**
* Human (Avg.): ~77%
* Human (Best): ~100%
* Direct: ~50%
* CoT: ~85%
* CoC (ours): ~98%
**6. Python + LM (repeated code):**
* Human (Avg.): ~70%
* Human (Best): ~95%
* Direct: ~70%
* CoT: ~73%
* CoC (ours): ~75%
**7. Python + LM (new code):**
* Human (Avg.): ~70%
* Human (Best): ~80%
* Direct: ~53%
* CoT: ~65%
* CoC (ours): ~73%
### Key Observations
* CoC (ours) generally outperforms other methods (Direct, CoT) across most tasks.
* Human (Best) performance is consistently high across all tasks.
* Direct method shows lower performance compared to other methods, especially in Alg and Python only (repeated code) tasks.
* The performance of all methods varies depending on the task.
### Interpretation
The bar chart provides a comparative analysis of different methods for various tasks. The CoC (ours) method appears to be a strong performer, often exceeding the performance of Direct and CoT methods. The Human (Best) performance represents an upper bound or ideal performance level. The differences in performance across tasks suggest that the effectiveness of each method is task-dependent. The "Python only" tasks show a significant performance boost with the CoC method, especially when dealing with repeated code. The addition of Language Models (LM) in the "Python + LM" tasks seems to narrow the performance gap between the different methods.