## Histogram: Sentence-Stride Δ||h||
### Overview
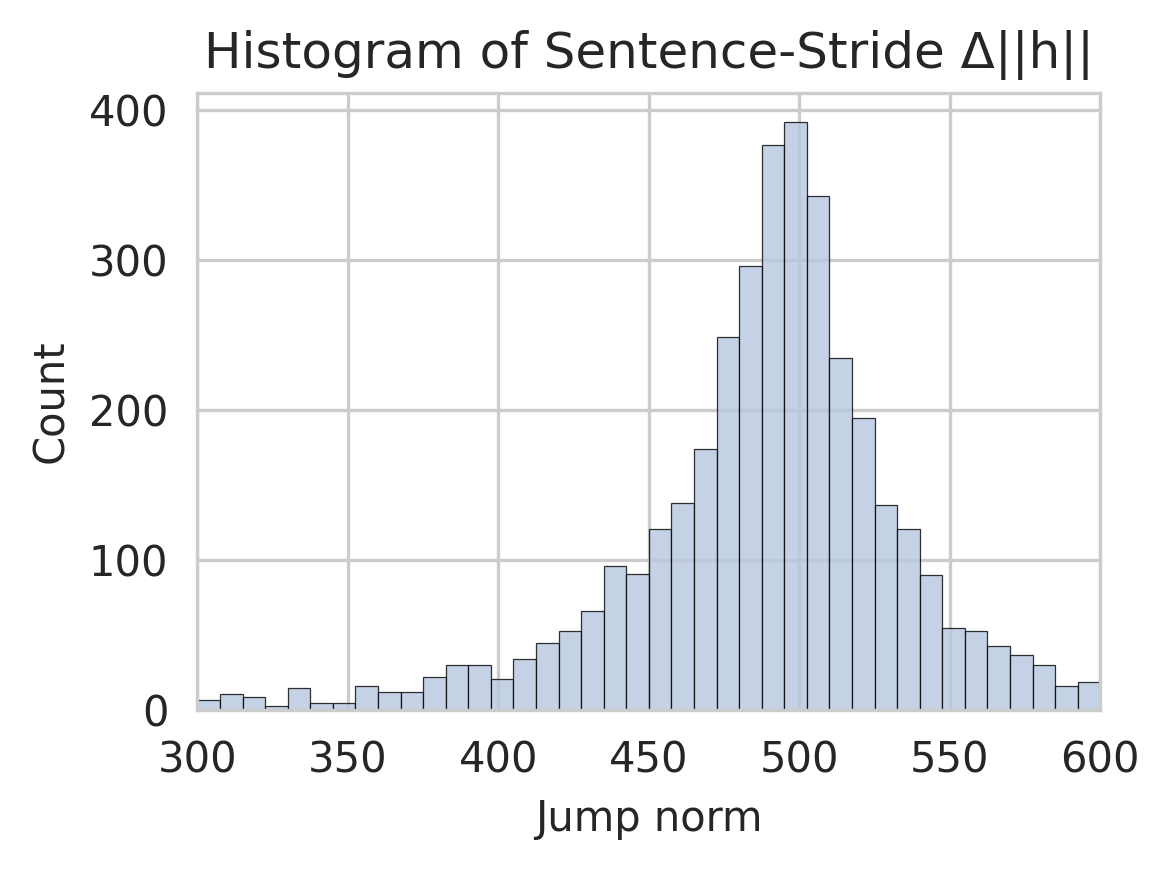
The image displays a histogram titled "Histogram of Sentence-Stride Δ||h||". It visualizes the frequency distribution of a metric labeled "Jump norm". The chart is a standard bar histogram with a light blue fill and dark outlines for each bar, set against a white background with a light gray grid.
### Components/Axes
* **Title:** "Histogram of Sentence-Stride Δ||h||" (Top center). The notation Δ||h|| suggests a change in the norm of a vector `h`, likely related to hidden states in a sequence model.
* **X-Axis:**
* **Label:** "Jump norm" (Bottom center).
* **Scale:** Linear scale ranging from 300 to 600.
* **Major Tick Marks:** 300, 350, 400, 450, 500, 550, 600.
* **Y-Axis:**
* **Label:** "Count" (Left center, rotated vertically).
* **Scale:** Linear scale ranging from 0 to 400.
* **Major Tick Marks:** 0, 100, 200, 300, 400.
* **Data Series:** A single series represented by vertical bars. Each bar's height corresponds to the count of observations within a specific bin (range) of "Jump norm" values.
* **Grid:** A light gray grid is present, with vertical lines at each major x-axis tick and horizontal lines at each major y-axis tick.
### Detailed Analysis
The histogram shows a unimodal, roughly symmetric distribution centered near 500.
* **Range:** The data spans from approximately 300 to 600 on the "Jump norm" axis.
* **Peak (Mode):** The highest frequency occurs in the bin centered at or very near 500. The count for this peak bin is approximately 390 (just below the 400 line).
* **Distribution Shape:**
* **Left Tail (300-450):** Counts are low and increase gradually. The bin at 300 has a count near 10. The count rises to approximately 100 by the bin at 450.
* **Central Peak (450-550):** There is a sharp increase in counts from 450 to the peak at 500. The bins immediately adjacent to the peak (approx. 490 and 510) have counts of approximately 375 and 340, respectively.
* **Right Tail (550-600):** Counts decrease more steeply after the peak than they rose before it. The count drops to approximately 100 by the bin at 550 and falls to near 20 by the bin at 600.
* **Approximate Bin Values (Selected):**
* Jump norm ~300: Count ≈ 10
* Jump norm ~400: Count ≈ 30
* Jump norm ~450: Count ≈ 100
* Jump norm ~475: Count ≈ 250
* Jump norm ~500: Count ≈ 390 (Peak)
* Jump norm ~525: Count ≈ 200
* Jump norm ~550: Count ≈ 100
* Jump norm ~600: Count ≈ 20
### Key Observations
1. **Central Tendency:** The distribution is strongly centered around a "Jump norm" value of 500.
2. **Spread:** The majority of the data (the bulk of the distribution) lies between approximately 450 and 550.
3. **Symmetry:** The distribution is approximately symmetric, though the decline in counts for values greater than 500 appears slightly steeper than the incline for values less than 500.
4. **Outliers:** There are no extreme outliers. The tails taper off smoothly to low counts at the extremes of the observed range (300 and 600).
### Interpretation
This histogram characterizes the magnitude of change (Δ||h||) in a hidden state vector `h` between consecutive sentences or strides in a sequence. The "Jump norm" is the quantitative measure of this change.
* **What the data suggests:** The process generating these changes produces a consistent, predictable output. The strong central peak at 500 indicates that the most common magnitude of change between sentences is around this value. The relatively narrow spread suggests the process has low variance; large deviations from the typical change magnitude are uncommon.
* **How elements relate:** The x-axis ("Jump norm") is the measured variable, and the y-axis ("Count") shows how often each magnitude occurs. The shape of the histogram directly reveals the probability distribution of the change magnitude.
* **Notable patterns/anomalies:** The near-perfect unimodal and symmetric shape is notable. It suggests the underlying mechanism for generating `h` changes may be governed by a process that produces normally distributed (Gaussian) increments, or a process that converges to such a distribution. The absence of multiple peaks indicates a single, dominant mode of operation for the measured change. The slight left-skew (longer tail towards lower values) could imply that smaller-than-average changes are slightly more common than larger-than-average ones, but the effect is minimal.