# Technical Data Extraction: Conductance (G) vs. Spin-Orbit Coupling ($\lambda_I/t$)
This document provides a comprehensive extraction of the data and trends presented in the provided scientific plot, which illustrates the conductance properties of a physical system (likely a topological insulator or graphene-based nanostructure) under varying parameters.
## 1. Metadata and Global Parameters
The image contains a header with specific physical constants used for the simulation:
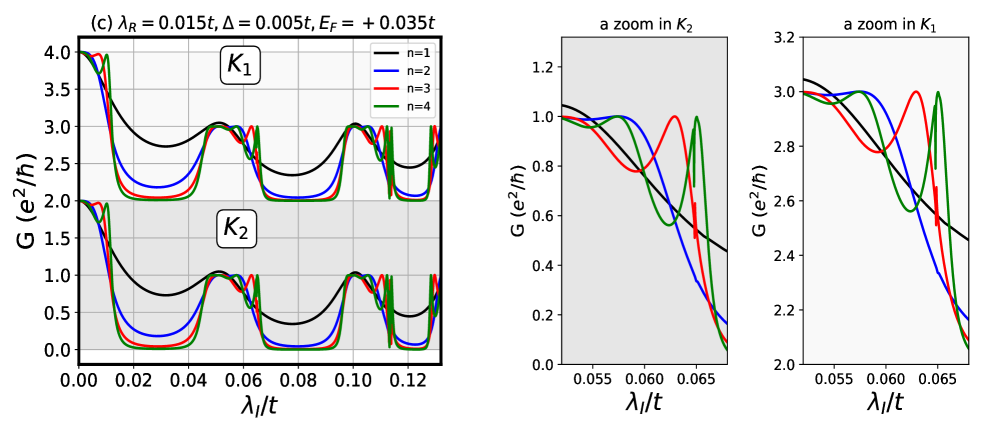
* **Figure Label:** (c)
* **Rashba Spin-Orbit Coupling ($\lambda_R$):** $0.015t$
* **Exchange Field/Gap ($\Delta$):** $0.005t$
* **Fermi Energy ($E_F$):** $+0.035t$
* **Units:** Conductance is measured in units of $e^2/\hbar$. The x-axis is a dimensionless ratio $\lambda_I/t$.
---
## 2. Main Plot Analysis (Left Panel)
The left panel shows the conductance $G$ as a function of $\lambda_I/t$ ranging from $0.00$ to approximately $0.13$. It is divided into two vertically stacked regions labeled $K_1$ and $K_2$.
### Component Isolation
* **Region $K_1$ (Top):** Conductance values range from $2.0$ to $4.0$.
* **Region $K_2$ (Bottom):** Conductance values range from $0.0$ to $2.0$.
* **Legend (Top Right):** Located at approximately $[x=0.4, y=0.1]$ relative to the left panel's top-right corner.
* **Black line:** $n=1$
* **Blue line:** $n=2$
* **Red line:** $n=3$
* **Green line:** $n=4$
### Data Trends and Observations
1. **Initial State ($\lambda_I/t = 0$):** All lines start at quantized values. In $K_1$, $G \approx 4.0$. In $K_2$, $G \approx 2.0$.
2. **Oscillatory Behavior:** The conductance exhibits periodic "dips" and "peaks." Major peaks occur near $\lambda_I/t \approx 0.05, 0.10,$ and $0.13$.
3. **Effect of $n$:**
* **$n=1$ (Black):** Shows the smoothest transitions and highest baseline conductance between peaks. It acts as an upper envelope for the other series.
* **$n=2, 3, 4$ (Blue, Red, Green):** As $n$ increases, the conductance drops more sharply toward zero (in $K_2$) or toward $2.0$ (in $K_1$) in the regions between peaks.
* **Trend:** Higher $n$ values result in more pronounced oscillations and sharper features.
---
## 3. Zoomed Analysis (Right Panels)
Two sub-plots provide high-resolution views of the transition region near $\lambda_I/t \approx 0.06$.
### Sub-plot: "a zoom in $K_2$" (Middle)
* **X-axis range:** $\approx 0.052$ to $0.068$
* **Y-axis range:** $0.0$ to $1.3$
* **Trend Verification:**
* **Black ($n=1$):** Slopes downward monotonically from $\approx 1.05$ to $\approx 0.45$.
* **Blue ($n=2$):** Slopes downward with a slight shoulder near $0.060$, dropping sharply after $0.062$.
* **Red ($n=3$):** Exhibits a distinct local peak at $\approx 0.063$ before dropping.
* **Green ($n=4$):** Exhibits the most complex behavior with two distinct oscillations/peaks between $0.055$ and $0.065$ before a sharp vertical-like drop at $0.065$.
### Sub-plot: "a zoom in $K_1$" (Right)
* **X-axis range:** $\approx 0.052$ to $0.068$
* **Y-axis range:** $2.0$ to $3.2$
* **Trend Verification:**
* This plot mirrors the behavior of the $K_2$ zoom but shifted upward by exactly $2.0$ units of $e^2/\hbar$.
* **Black ($n=1$):** Starts at $\approx 3.05$, ends at $\approx 2.45$.
* **Green ($n=4$):** Shows a sharp resonance peak reaching $G=3.0$ at $\lambda_I/t \approx 0.065$.
---
## 4. Summary Table of Key Data Points (Approximate)
| $\lambda_I/t$ Value | Feature | $K_2$ Conductance ($n=4$, Green) | $K_1$ Conductance ($n=4$, Green) |
| :--- | :--- | :--- | :--- |
| 0.00 | Origin | 2.0 | 4.0 |
| 0.02 - 0.04 | First Trough | $\approx 0.0$ | $\approx 2.0$ |
| 0.05 | First Major Peak | $\approx 1.0$ | $\approx 3.0$ |
| 0.065 | Resonance (Zoom) | Sharp Peak to $\approx 1.0$ | Sharp Peak to $\approx 3.0$ |
| 0.08 | Second Trough | $\approx 0.0$ | $\approx 2.0$ |
| 0.10 | Second Major Peak | $\approx 1.0$ | $\approx 3.0$ |
---
## 5. Conclusion
The data indicates a perfectly synchronized conductance behavior between the $K_1$ and $K_2$ valleys, differing only by a constant offset of $2 e^2/\hbar$. The parameter $n$ controls the sharpness of the conductance quantization, with higher $n$ leading to more rapid switching between conducting and non-conducting states as the intrinsic spin-orbit coupling ($\lambda_I$) is tuned.