## Line Graph: Power and Clock Frequency Over Time
### Overview
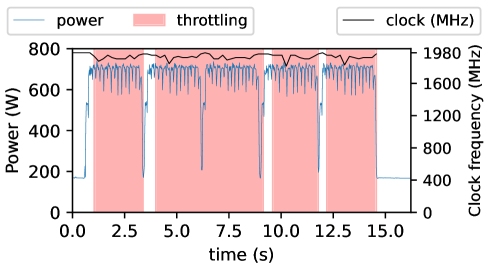
The image is a line graph depicting the relationship between power consumption, clock frequency, and system throttling over a 15-second interval. Two data series are plotted: power (blue line) and clock frequency (black line), with a pink shaded region indicating throttling periods. The graph includes dual y-axes for power (W) and clock frequency (MHz), with time (s) on the x-axis.
---
### Components/Axes
- **X-axis**: Time (s), labeled "time (s)", with ticks at 0.0, 2.5, 5.0, 7.5, 10.0, 12.5, and 15.0 seconds.
- **Left Y-axis**: Power (W), labeled "Power (W)", ranging from 0 to 800 W in increments of 200.
- **Right Y-axis**: Clock frequency (MHz), labeled "Clock frequency (MHz)", ranging from 0 to 1980 MHz in increments of 400.
- **Legend**: Located in the top-left corner, with:
- Blue line: "power"
- Pink shaded area: "throttling"
- Black line: "clock (MHz)"
- **Title**: Implied by axis labels and legend; no explicit title text visible.
---
### Detailed Analysis
1. **Power (Blue Line)**:
- Starts at 0 W at 0.0s.
- Rises sharply to ~700 W by 0.5s.
- Fluctuates between ~600–700 W during non-throttling periods.
- Drops to ~200 W during throttling periods (pink shading), with sharp vertical declines.
- Recovers to ~600–700 W after throttling ends.
2. **Clock Frequency (Black Line)**:
- Starts at ~1980 MHz at 0.0s.
- Drops to ~400 MHz during throttling periods.
- Recovers to ~1980 MHz after throttling ends.
- Shows minor fluctuations (~1900–1980 MHz) during non-throttling periods.
3. **Throttling (Pink Shaded Regions)**:
- Occurs in four distinct intervals:
- 0.5–2.5s
- 4.5–6.5s
- 8.5–10.5s
- 12.5–14.5s
- Each throttling period correlates with a drop in both power and clock frequency.
---
### Key Observations
- **Inverse Relationship**: Power and clock frequency are inversely correlated during throttling periods.
- **Periodic Throttling**: Throttling intervals are evenly spaced (~2.5s apart), suggesting a cyclical or controlled process.
- **Sharp Transitions**: Power and clock frequency changes are abrupt during throttling onset/offset, indicating reactive system behavior.
- **Recovery Time**: System recovers to baseline power (~700 W) and clock frequency (~1980 MHz) within ~0.5s after throttling ends.
---
### Interpretation
This graph illustrates a system undergoing thermal or performance throttling to manage heat or power constraints. The periodic drops in clock frequency and power consumption suggest the system dynamically adjusts its performance to prevent overheating or energy overload. The regularity of throttling intervals implies a programmed or workload-driven trigger (e.g., CPU-intensive tasks followed by cooling periods). The sharp transitions indicate an immediate response mechanism, while the recovery phase reflects the system’s return to normal operation after thermal stabilization. The data highlights the trade-off between performance (clock speed) and efficiency (power consumption) under load management.