## Bar Chart: Distribution of Triples per Entity in MetaQA
### Overview
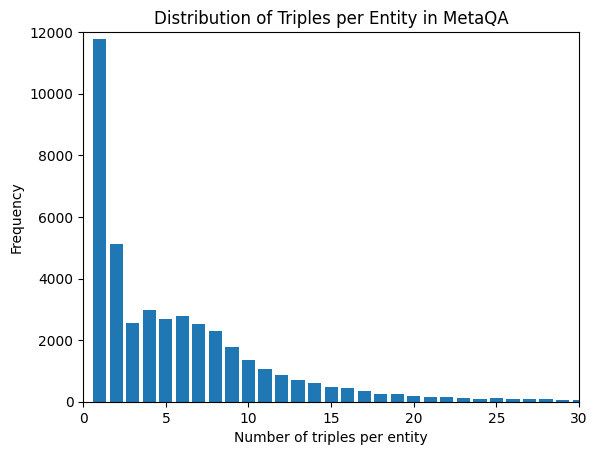
The image is a bar chart showing the distribution of triples per entity in the MetaQA dataset. The x-axis represents the number of triples per entity, and the y-axis represents the frequency (count) of entities with that number of triples. The chart indicates a highly skewed distribution, with a large number of entities having a small number of triples and a decreasing number of entities as the number of triples increases.
### Components/Axes
* **Title:** Distribution of Triples per Entity in MetaQA
* **X-axis:** Number of triples per entity
* Scale: 0 to 30, with tick marks at intervals of 5.
* **Y-axis:** Frequency
* Scale: 0 to 12000, with tick marks at intervals of 2000.
* **Bars:** Blue bars representing the frequency of each number of triples per entity.
### Detailed Analysis
The chart displays the frequency of entities based on the number of triples they contain. The data points are extracted from the bar heights.
* **1 triple per entity:** Approximately 11800
* **2 triples per entity:** Approximately 5200
* **3 triples per entity:** Approximately 2600
* **4 triples per entity:** Approximately 3000
* **5 triples per entity:** Approximately 2800
* **6 triples per entity:** Approximately 2700
* **7 triples per entity:** Approximately 2500
* **8 triples per entity:** Approximately 2000
* **9 triples per entity:** Approximately 1800
* **10 triples per entity:** Approximately 1200
* **11 triples per entity:** Approximately 900
* **12 triples per entity:** Approximately 800
* **13 triples per entity:** Approximately 700
* **14 triples per entity:** Approximately 600
* **15 triples per entity:** Approximately 500
* **16 triples per entity:** Approximately 400
* **17 triples per entity:** Approximately 350
* **18 triples per entity:** Approximately 300
* **19 triples per entity:** Approximately 250
* **20 triples per entity:** Approximately 200
* **21 triples per entity:** Approximately 150
* **22 triples per entity:** Approximately 125
* **23 triples per entity:** Approximately 100
* **24 triples per entity:** Approximately 75
* **25 triples per entity:** Approximately 50
* **26 triples per entity:** Approximately 40
* **27 triples per entity:** Approximately 30
* **28 triples per entity:** Approximately 20
* **29 triples per entity:** Approximately 10
### Key Observations
* The distribution is heavily skewed to the right.
* The frequency decreases rapidly as the number of triples per entity increases.
* A significant portion of entities have only 1 or 2 triples.
### Interpretation
The chart illustrates that in the MetaQA dataset, most entities have a relatively small number of triples associated with them. This suggests that the knowledge graph underlying MetaQA may be sparse, with many entities having limited connections to other entities. The long tail of the distribution indicates that some entities have a significantly larger number of triples, potentially representing more central or well-defined concepts within the dataset. This distribution is important for understanding the characteristics of the MetaQA dataset and can inform the design of effective question answering models.