## Scatter Plot: Accuracy vs Log(Perplexity)
### Overview
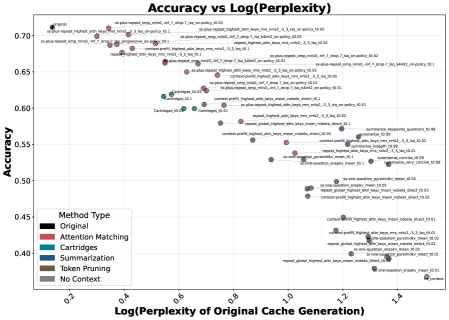
The image is a scatter plot comparing **Accuracy** (y-axis) against **Log(Perplexity of Original Cache Generation)** (x-axis). Data points are color-coded by method type, with labels indicating specific configurations or parameters. The plot visualizes trade-offs between model performance (accuracy) and computational complexity (perplexity).
---
### Components/Axes
- **X-axis**: Log(Perplexity of Original Cache Generation)
- Range: 0.2 to 1.4
- Labels: Numerical values (0.2, 0.4, 0.6, 0.8, 1.0, 1.2, 1.4)
- **Y-axis**: Accuracy
- Range: 0.40 to 0.70
- Labels: Numerical values (0.40, 0.45, 0.50, 0.55, 0.60, 0.65, 0.70)
- **Legend**: Located in the bottom-left corner, mapping colors to method types:
- **Black**: Original
- **Red**: Attention Matching
- **Teal**: Cartridges
- **Blue**: Summarization
- **Brown**: Token Pruning
- **Gray**: No Context
---
### Detailed Analysis
#### Data Points and Labels
- **Original (Black)**:
- Highest accuracy (~0.70) and lowest perplexity (~0.2).
- Label: "original"
- **Attention Matching (Red)**:
- Accuracy ~0.65–0.70, perplexity ~0.3–0.5.
- Labels: "attention_matching_highest_attn_keys_mean_nobeta_direct_10.00", "attention_matching_highest_attn_keys_mean_nobeta_direct_10.01"
- **Cartridges (Teal)**:
- Accuracy ~0.55–0.60, perplexity ~0.6–0.8.
- Labels: "cartridges_10.00", "cartridges_10.01"
- **Summarization (Blue)**:
- Accuracy ~0.50–0.55, perplexity ~0.8–1.0.
- Labels: "summarization_highest_attn_keys_mean_nobeta_direct_10.00", "summarization_highest_attn_keys_mean_nobeta_direct_10.01"
- **Token Pruning (Brown)**:
- Accuracy ~0.45–0.50, perplexity ~1.0–1.2.
- Labels: "token_pruning_highest_attn_keys_mean_nobeta_direct_10.00", "token_pruning_highest_attn_keys_mean_nobeta_direct_10.01"
- **No Context (Gray)**:
- Lowest accuracy (~0.40–0.45), highest perplexity (~1.2–1.4).
- Labels: "no_context_highest_attn_keys_mean_nobeta_direct_10.00", "no_context_highest_attn_keys_mean_nobeta_direct_10.01"
#### Trends
- **Inverse Relationship**: Higher perplexity (x-axis) generally correlates with lower accuracy (y-axis).
- **Method-Specific Performance**:
- **Original** and **Attention Matching** dominate the top-left (high accuracy, low perplexity).
- **Cartridges** and **Summarization** cluster in the middle, showing moderate trade-offs.
- **Token Pruning** and **No Context** occupy the bottom-right (low accuracy, high perplexity).
---
### Key Observations
1. **Original Method**: Optimal performance (highest accuracy, lowest perplexity).
2. **Attention Matching**: Slightly lower accuracy than Original but still high, with slightly higher perplexity.
3. **Cartridges**: Moderate accuracy and perplexity, suggesting a balance between complexity and performance.
4. **Summarization**: Lower accuracy than Cartridges despite similar perplexity, indicating potential inefficiencies.
5. **Token Pruning/No Context**: Poor performance, with high perplexity and low accuracy.
---
### Interpretation
The plot highlights a clear trade-off between **model complexity (perplexity)** and **performance (accuracy)**. The **Original** and **Attention Matching** methods outperform others by maintaining high accuracy with minimal perplexity, suggesting they are more efficient or well-optimized. In contrast, **Token Pruning** and **No Context** methods degrade performance significantly, likely due to excessive simplification or lack of contextual information.
The **Cartridges** and **Summarization** methods occupy a middle ground, indicating that while they reduce perplexity compared to Token Pruning/No Context, their accuracy drops compared to Original/Attention Matching. This suggests that methods like Cartridges may prioritize computational efficiency over accuracy, while Summarization might introduce bottlenecks.
The **No Context** method’s extreme position (lowest accuracy, highest perplexity) underscores the importance of contextual information in model performance.
**Notable Anomalies**:
- Some labels (e.g., "context_profile_highest_attn_keys_mean_nobeta_direct_10.00") imply specific configurations, but their exact impact on performance is not quantified in the plot.
- The "original" method’s dominance suggests it may serve as a baseline for comparison.
This analysis emphasizes the need to balance model complexity with practical performance requirements, depending on the use case.