\n
## Bar Chart with Line Overlay: Latency vs. Accuracy for Top-K Results
### Overview
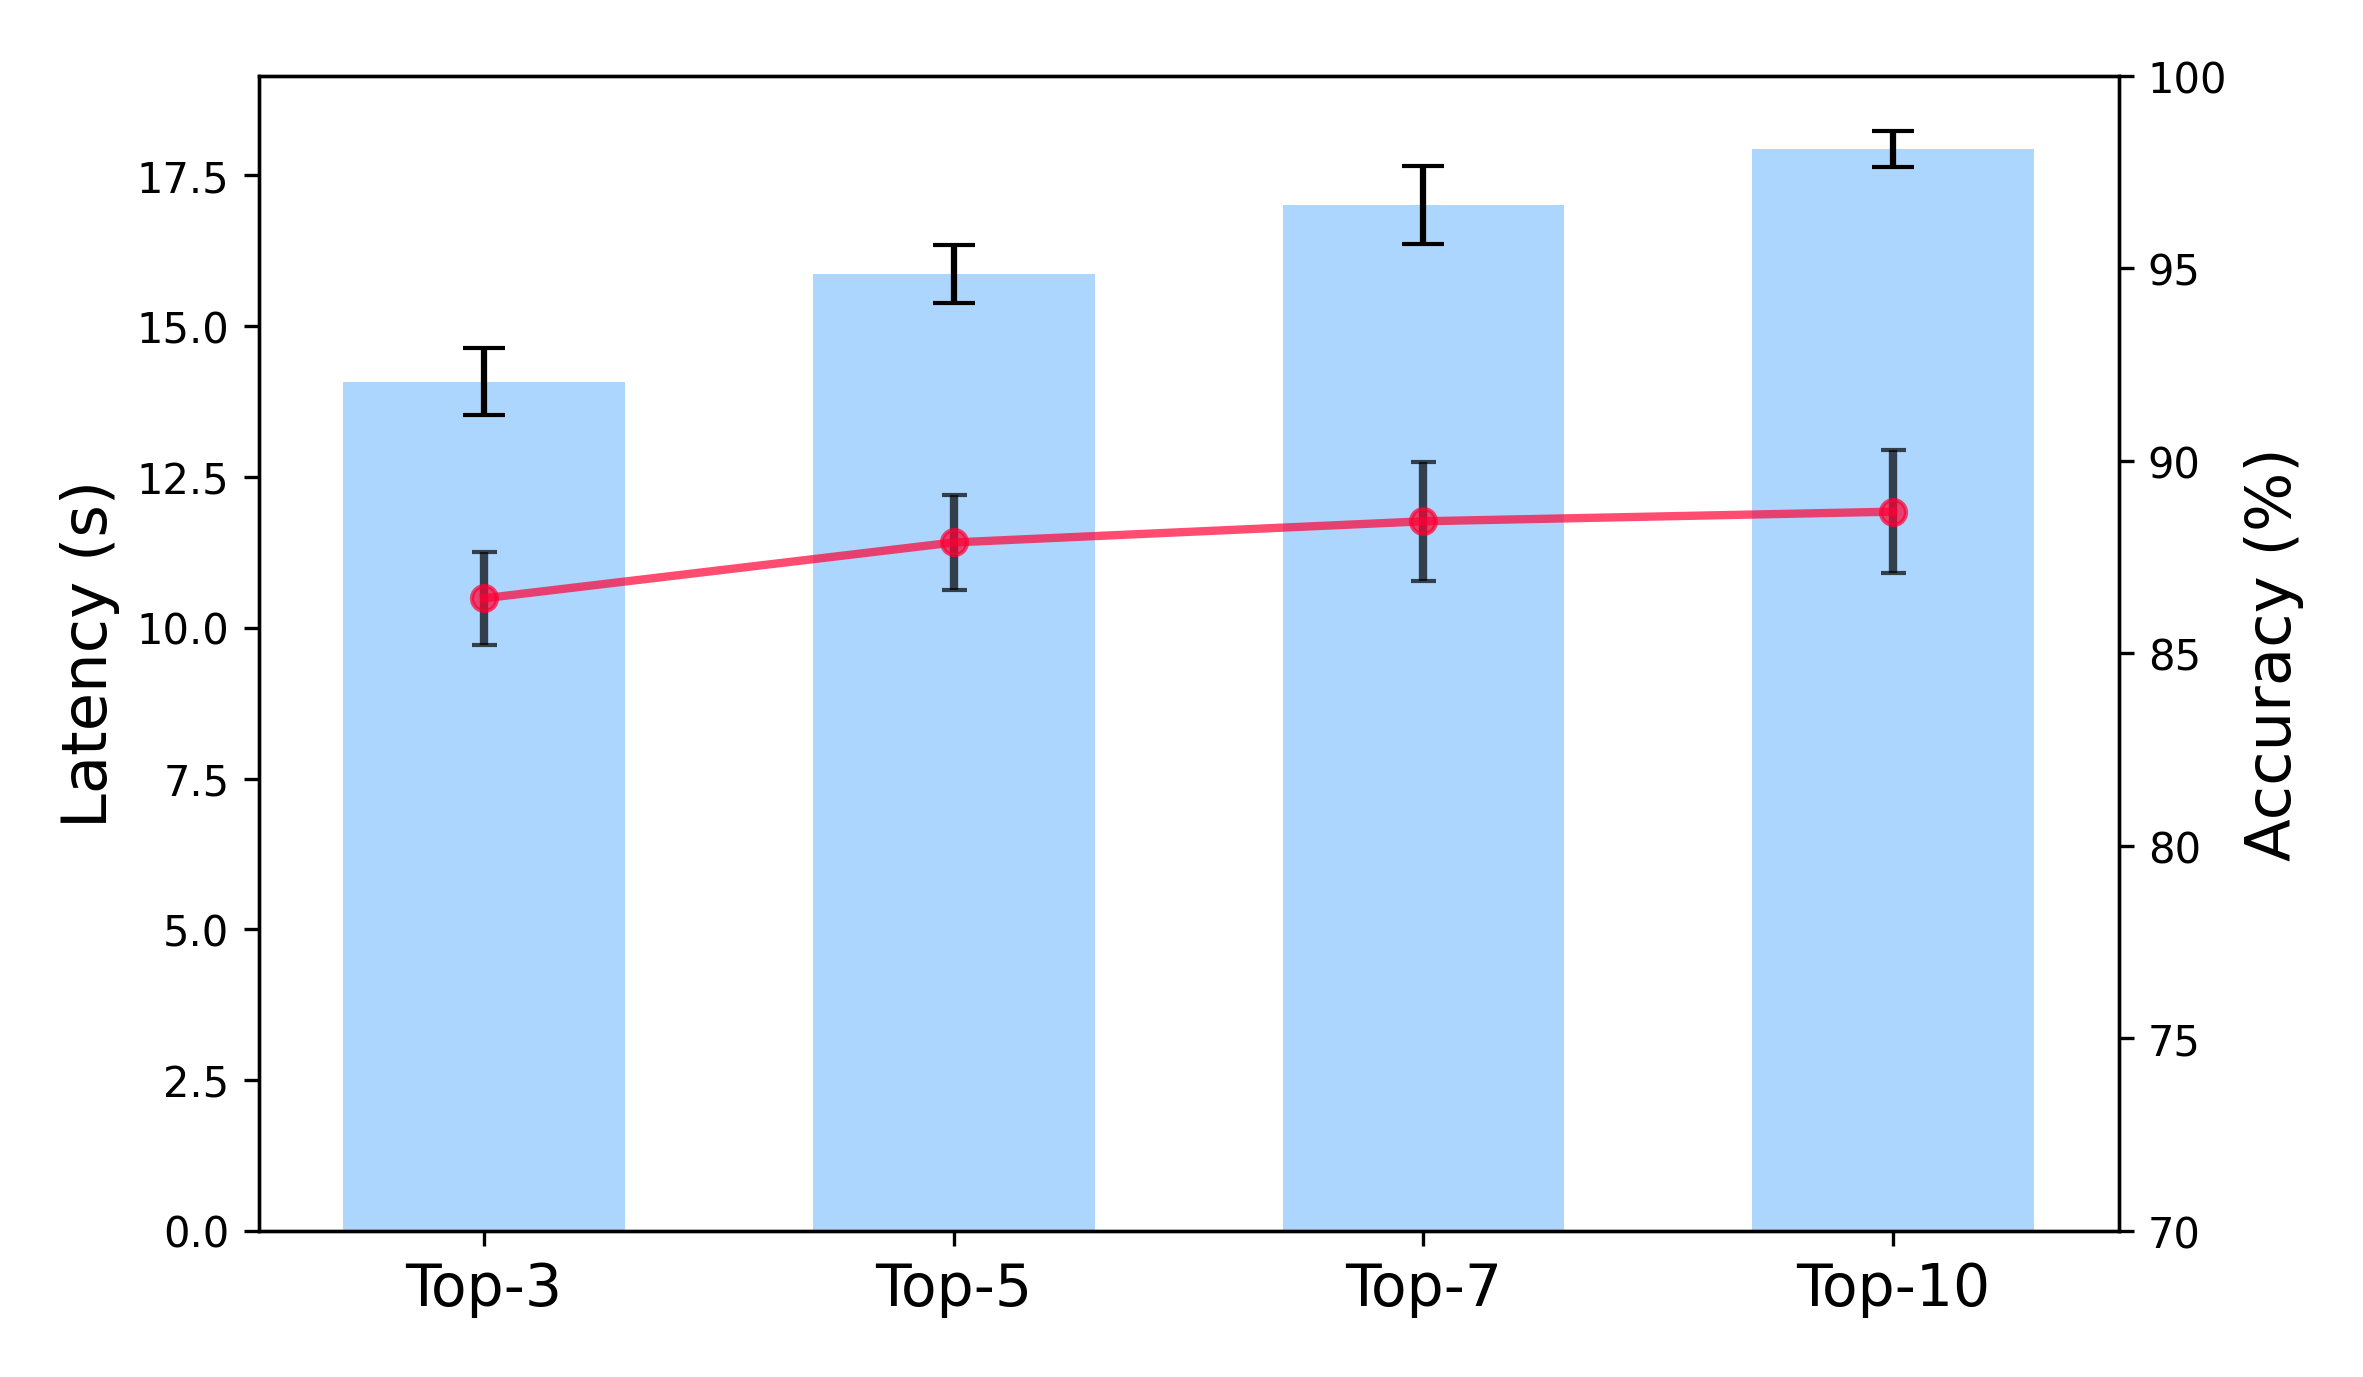
This image presents a bar chart comparing latency (in seconds) with a line graph showing accuracy (in percentage) for different values of 'Top-K' results. The 'Top-K' values are 3, 5, 7, and 10. Each bar represents the average latency for a given Top-K value, with error bars indicating the variance. The line graph overlays the bar chart, showing the accuracy corresponding to each Top-K value, also with error bars.
### Components/Axes
* **X-axis:** "Top-K" with categories: Top-3, Top-5, Top-7, Top-10.
* **Left Y-axis:** "Latency (s)" ranging from 0 to 18 seconds.
* **Right Y-axis:** "Accuracy (%)" ranging from 70% to 100%.
* **Bar Chart:** Represents Latency. Bars are light blue with black outlines.
* **Line Graph:** Represents Accuracy. Line is red with circular data points and error bars.
* **Error Bars:** Present on both the bar chart (latency) and line graph (accuracy), indicating the variance or standard deviation.
### Detailed Analysis
**Latency (Bar Chart):**
* **Top-3:** The bar is approximately 14.8 seconds tall, with error bars extending from roughly 13.5 to 16.1 seconds.
* **Top-5:** The bar is approximately 16.2 seconds tall, with error bars extending from roughly 14.8 to 17.6 seconds.
* **Top-7:** The bar is approximately 17.2 seconds tall, with error bars extending from roughly 15.8 to 18.6 seconds.
* **Top-10:** The bar is approximately 17.8 seconds tall, with error bars extending from roughly 16.4 to 19.2 seconds.
The latency generally increases as the Top-K value increases.
**Accuracy (Line Graph):**
* **Top-3:** Accuracy is approximately 10.2%, with error bars extending from roughly 8.5 to 11.9%.
* **Top-5:** Accuracy is approximately 11.8%, with error bars extending from roughly 10.4 to 13.2%.
* **Top-7:** Accuracy is approximately 11.6%, with error bars extending from roughly 10.2 to 13.0%.
* **Top-10:** Accuracy is approximately 11.3%, with error bars extending from roughly 9.9 to 12.7%.
The accuracy initially increases from Top-3 to Top-5, then slightly decreases for Top-7 and Top-10, remaining relatively stable.
### Key Observations
* There is a clear trade-off between latency and accuracy. As the number of considered results (Top-K) increases, the latency increases, but the accuracy initially improves and then plateaus.
* The error bars suggest that the variance in latency is relatively consistent across different Top-K values.
* The accuracy error bars are also relatively consistent, indicating similar levels of uncertainty in accuracy measurements.
* The accuracy peaks at Top-5 and then slightly declines, suggesting diminishing returns from considering more than the top 5 results.
### Interpretation
The data suggests that there's a point of diminishing returns when increasing the number of results considered (Top-K). While increasing Top-K initially improves accuracy, the latency cost increases proportionally. The optimal balance between latency and accuracy appears to be around Top-5, where accuracy is relatively high, and latency is not excessively high. The slight decrease in accuracy for Top-7 and Top-10, coupled with the increased latency, indicates that considering more results beyond Top-5 does not significantly improve performance and may even slightly degrade it. This could be due to the inclusion of less relevant results in the larger set, which introduces noise and reduces overall accuracy. The error bars indicate that these trends are statistically significant, as the ranges do not overlap substantially. This chart is useful for system designers to determine the optimal value of K for their application, balancing the need for speed (low latency) with the need for correctness (high accuracy).