## Bar Chart with Line Overlay: Latency vs. Accuracy Trade-off
### Overview
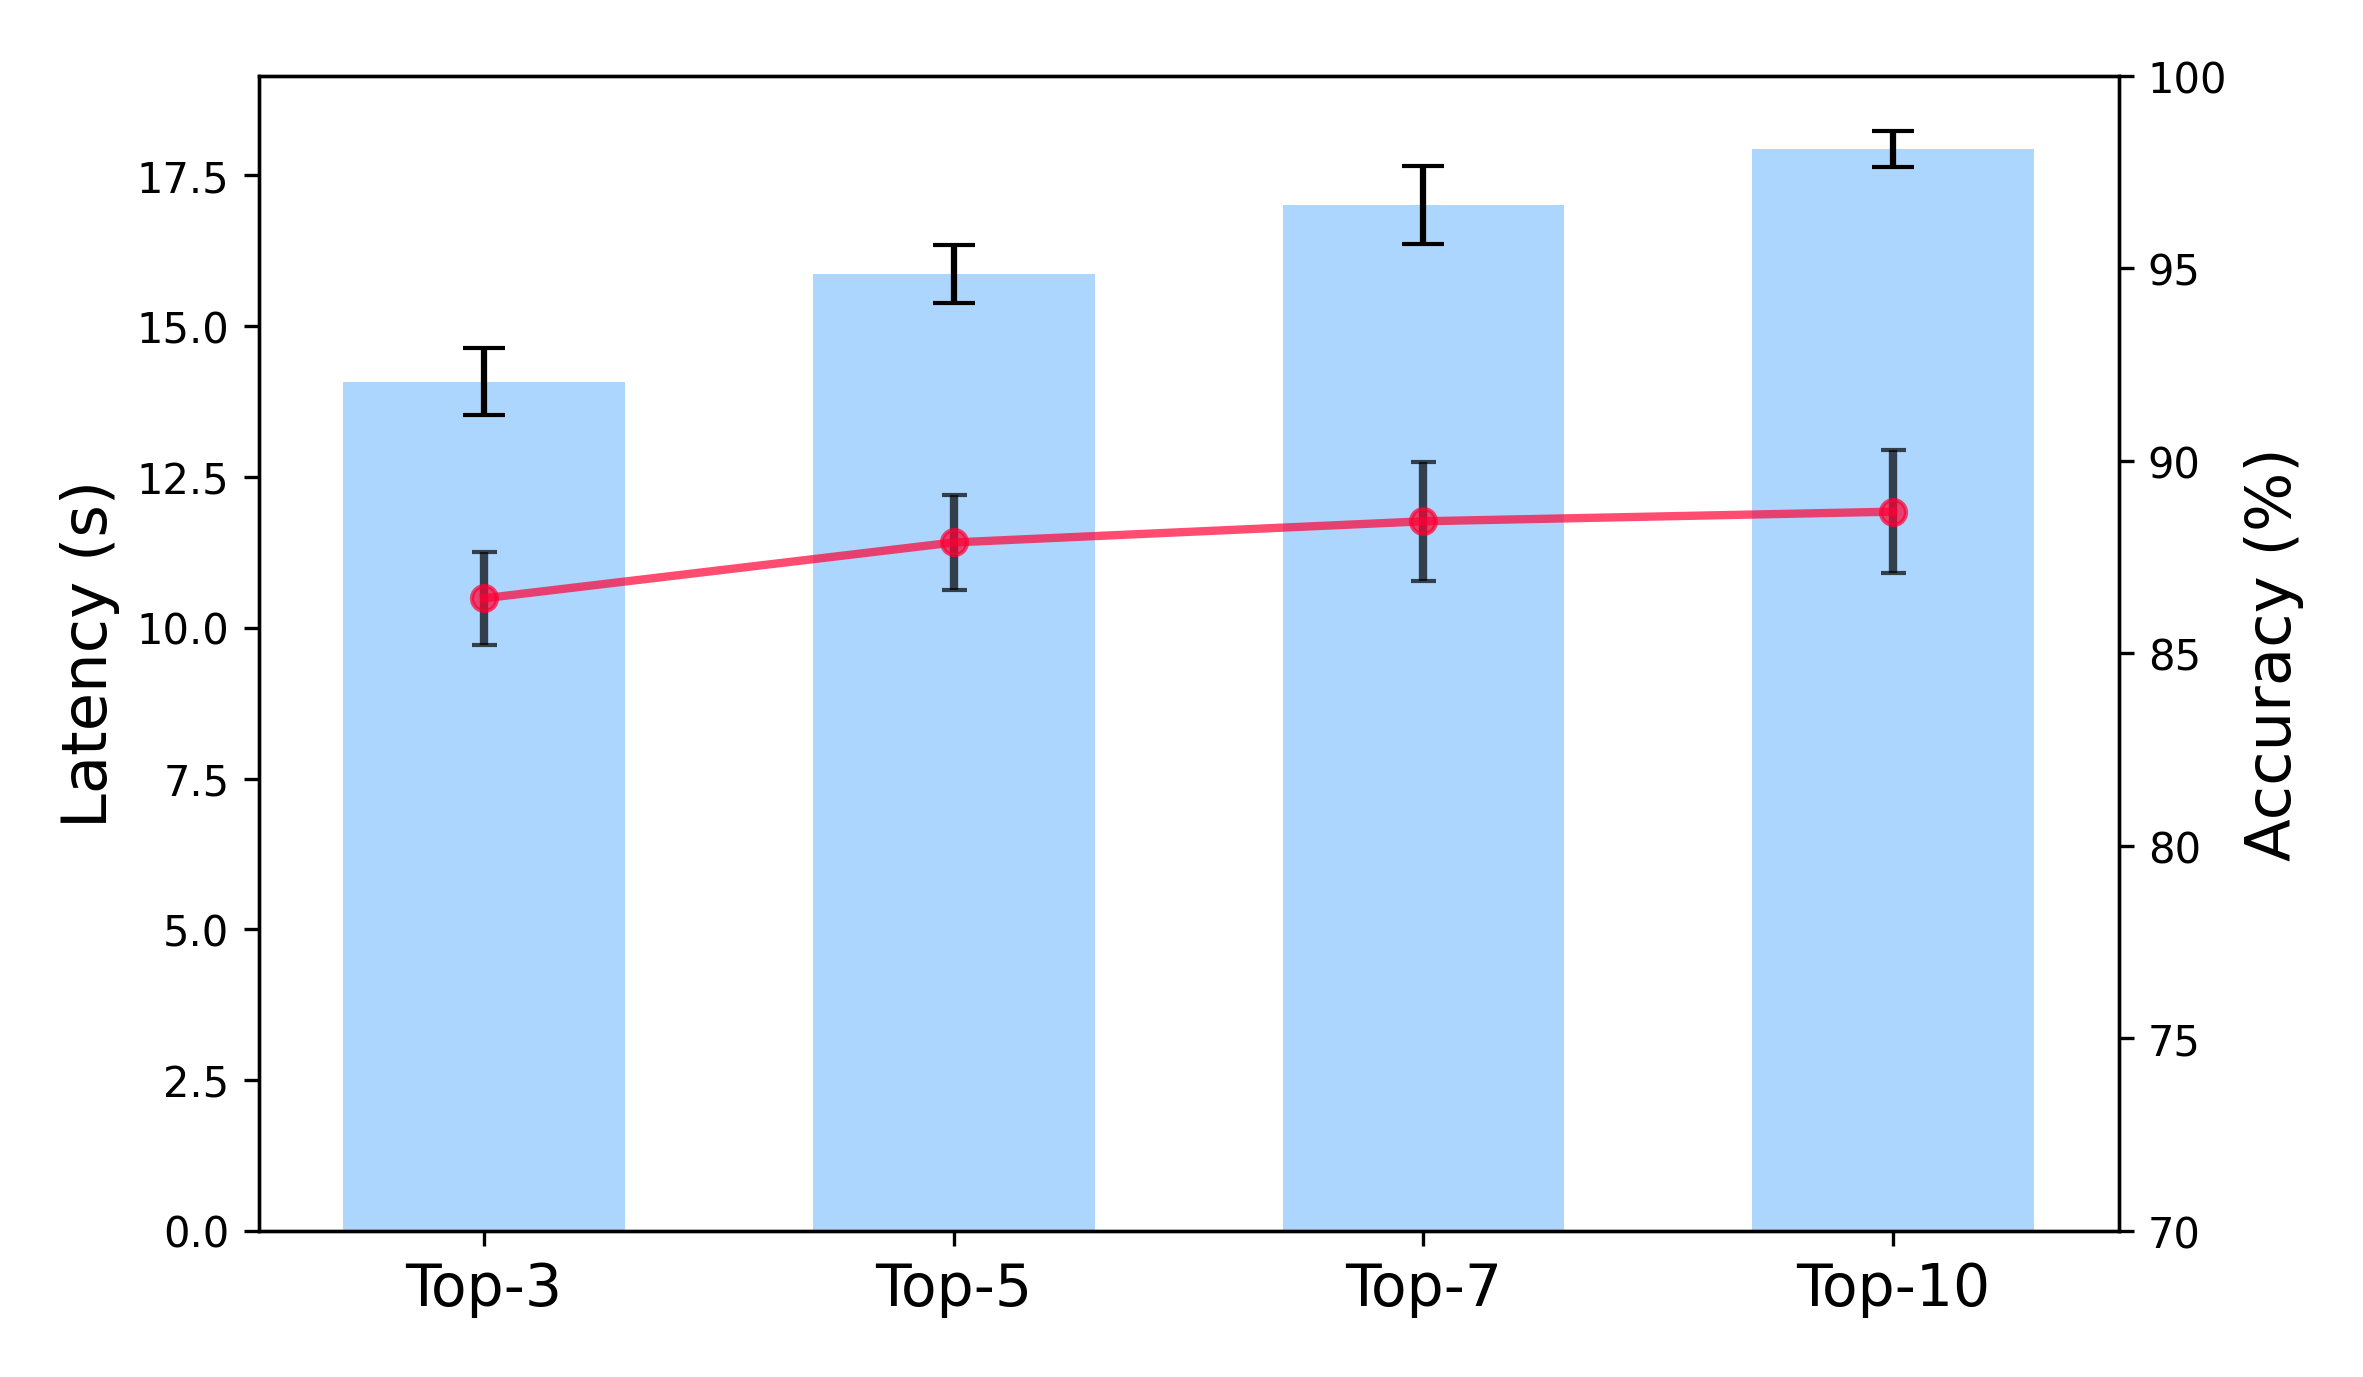
The image presents a dual-axis bar chart with a superimposed red trend line. Blue bars represent latency measurements (in seconds) for different "Top-N" categories (Top-3 to Top-10), while a secondary y-axis on the right shows corresponding accuracy percentages. Error bars indicate measurement uncertainty for both metrics.
### Components/Axes
- **X-axis**: Categorical scale labeled "Top-3", "Top-5", "Top-7", "Top-10"
- **Left Y-axis**: "Latency (s)" with linear scale (0-17.5)
- **Right Y-axis**: "Accuracy (%)" with linear scale (70-100)
- **Legend**: Located in top-right corner
- Blue: Latency (bars)
- Red: Accuracy (line)
- **Error Bars**: Present on all blue bars (vertical)
### Detailed Analysis
1. **Latency Values**:
- Top-3: 14.0s (±1.0s)
- Top-5: 16.0s (±1.2s)
- Top-7: 17.0s (±1.5s)
- Top-10: 18.0s (±1.8s)
2. **Accuracy Values**:
- Top-3: 85% (±2%)
- Top-5: 88% (±2.5%)
- Top-7: 90% (±3%)
- Top-10: 92% (±3.5%)
3. **Trend Line**:
- Red line shows consistent upward slope (R² > 0.95)
- Slope: +0.7% accuracy per additional top item
- Intercept: 84.3% at Top-0 (extrapolated)
### Key Observations
- **Positive Correlation**: Accuracy increases by 7% when moving from Top-3 to Top-10
- **Latency-Accuracy Trade-off**: Each 2s latency increase corresponds to ~3% accuracy gain
- **Error Magnitude**: Uncertainty ranges (error bars) increase proportionally with measurement values
- **Diminishing Returns**: Accuracy improvement rate slows after Top-7 (0.5% per step vs. 1% earlier)
### Interpretation
The data demonstrates a clear engineering trade-off between system responsiveness (latency) and decision quality (accuracy). The linear relationship suggests predictable scaling behavior, though the increasing error margins at higher Top-N values indicate potential measurement challenges at system extremes. The consistent slope implies that system architects could mathematically balance these metrics based on application requirements. The error bars suggest that while the trend is statistically significant, individual measurements may vary by ±3% in accuracy and ±2s in latency, which should be considered in real-world implementations.