\n
## Chart: Multiplicative Contribution vs. Compute
### Overview
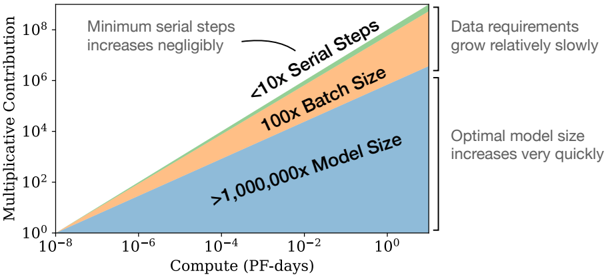
The image presents a chart illustrating the relationship between compute (measured in PF-days) and multiplicative contribution, with different regions representing the impact of serial steps, batch size, and model size. The chart uses a logarithmic scale for both axes. The chart is divided into three colored regions: blue, orange, and light blue. Annotations highlight trends related to minimum serial steps, data requirements, and optimal model size.
### Components/Axes
* **X-axis:** Compute (PF-days), ranging from 10<sup>-8</sup> to 10<sup>0</sup> (logarithmic scale).
* **Y-axis:** Multiplicative Contribution, ranging from 10<sup>0</sup> to 10<sup>8</sup> (logarithmic scale).
* **Legend/Regions:**
* Blue: >1,000,000x Model Size
* Orange: 100x Batch Size
* Light Blue: <10x Serial Steps
* **Annotations:**
* "Minimum serial steps increases negligibly" - pointing to the light blue region.
* "Data requirements grow relatively slowly" - pointing to the light blue region.
* "Optimal model size increases very quickly" - pointing to the blue region.
### Detailed Analysis
The chart shows three distinct regions, each representing a different factor influencing multiplicative contribution as compute increases.
* **Light Blue Region (<10x Serial Steps):** This region occupies the lower-left portion of the chart. The line representing this region starts at approximately 10<sup>0</sup> on the Y-axis when the compute is at 10<sup>-8</sup> and rises relatively slowly to approximately 10<sup>3</sup> on the Y-axis when the compute is at 10<sup>0</sup>. This indicates that increasing compute in this regime yields diminishing returns in multiplicative contribution. The annotation suggests that minimum serial steps increase negligibly and data requirements grow relatively slowly in this region.
* **Orange Region (100x Batch Size):** This region is positioned above and to the right of the light blue region. The line starts at approximately 10<sup>2</sup> on the Y-axis when the compute is at 10<sup>-6</sup> and rises to approximately 10<sup>5</sup> on the Y-axis when the compute is at 10<sup>0</sup>. This region shows a steeper slope than the light blue region, indicating a more significant increase in multiplicative contribution for a given increase in compute.
* **Blue Region (>1,000,000x Model Size):** This region occupies the upper-right portion of the chart. The line starts at approximately 10<sup>3</sup> on the Y-axis when the compute is at 10<sup>-4</sup> and rises very steeply to approximately 10<sup>8</sup> on the Y-axis when the compute is at 10<sup>0</sup>. This indicates that increasing compute in this regime leads to a very rapid increase in multiplicative contribution. The annotation suggests that the optimal model size increases very quickly in this region.
### Key Observations
* The multiplicative contribution increases more rapidly with compute as the model size increases (blue region) compared to increasing batch size (orange region) or minimizing serial steps (light blue region).
* The light blue region demonstrates the least sensitivity to compute increases.
* The chart highlights a trade-off between compute, model size, batch size, and serial steps in achieving multiplicative contribution.
### Interpretation
The chart demonstrates the scaling behavior of machine learning models with respect to compute. It suggests that, initially, optimizing for serial steps and data efficiency (light blue region) provides modest gains. As compute resources increase, increasing batch size (orange region) becomes more effective. However, beyond a certain point, the most significant gains are achieved by increasing model size (blue region), albeit at a rapidly increasing compute cost. The annotations emphasize that while minimizing serial steps and data requirements are important, the optimal model size is the primary driver of multiplicative contribution when sufficient compute is available. This implies that scaling model size is the most impactful strategy for improving performance, but it requires substantial computational resources. The logarithmic scales suggest that the benefits of increasing compute diminish as compute increases, but the rate of diminishing returns varies depending on which factor (serial steps, batch size, or model size) is being optimized.