## Diagram: Symbolic-Neuro-Symbolic Pipeline and Knowledge Graph Construction
### Overview
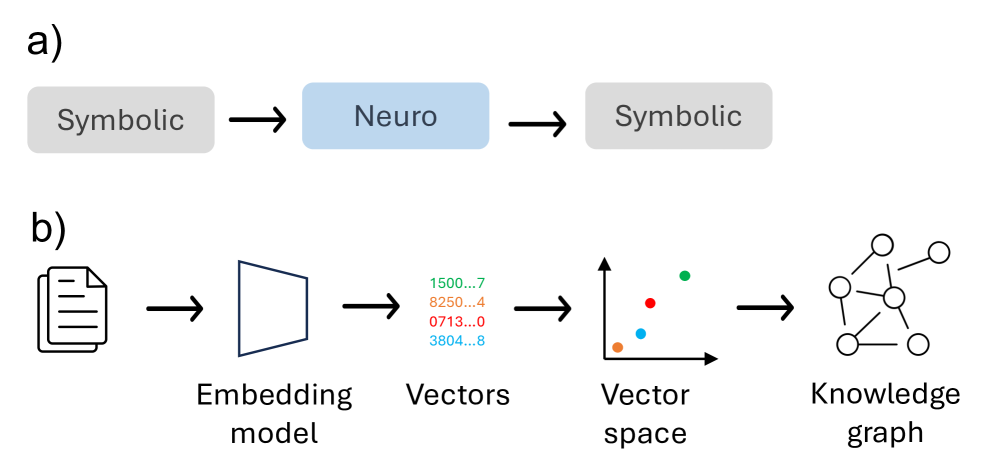
The image is a two-part technical diagram illustrating a conceptual pipeline for processing information. Part (a) shows a high-level, abstract flow between symbolic and neuro (neural) representations. Part (b) provides a more detailed, step-by-step breakdown of a specific process that transforms a document into a structured knowledge graph via embedding models and vector spaces.
### Components/Axes
The diagram is divided into two labeled sections:
* **a)** A three-stage linear flow.
* **b)** A five-stage linear flow.
**Part (a) Components:**
1. **Symbolic** (Gray box, left)
2. **Neuro** (Blue box, center)
3. **Symbolic** (Gray box, right)
* **Flow Direction:** Left to right, indicated by black arrows.
**Part (b) Components (from left to right):**
1. **Document Icon:** Represents the input source material.
2. **Embedding model:** Represented by a blue trapezoid icon.
3. **Vectors:** A list of four numerical sequences, each in a different color.
* Green: `1500...7`
* Orange: `8250...4`
* Red: `0713...0`
* Blue: `3804...8`
4. **Vector space:** A 3D coordinate system (x, y, z axes) containing four colored dots corresponding to the vector colors above.
5. **Knowledge graph:** A network diagram of interconnected nodes (circles) and edges (lines).
* **Flow Direction:** Left to right, indicated by black arrows between each stage.
### Detailed Analysis
The diagram describes a two-level process:
**Level 1 (Part a):** This is a conceptual model of a hybrid AI system. It suggests a cycle where symbolic data (e.g., rules, logic, structured knowledge) is processed by a neural network ("Neuro"), and the output is then converted back into a symbolic form. This is a common architecture in neuro-symbolic AI.
**Level 2 (Part b):** This details a specific technical pipeline for knowledge graph construction:
1. **Input:** A document (icon).
2. **Processing:** The document is fed into an **Embedding model**.
3. **Output of Model:** The model produces numerical **Vectors**. The ellipsis (`...`) indicates these are truncated representations of longer numerical sequences. The four distinct colors suggest four different data points or entities extracted from the document.
4. **Representation:** These vectors are plotted as points in a multi-dimensional **Vector space**. The spatial proximity of the colored dots (e.g., the red and blue dots appear closer together than the green dot) implies semantic similarity between the corresponding data points.
5. **Final Structure:** The relationships and similarities captured in the vector space are used to construct a **Knowledge graph**, where entities are nodes and their relationships are edges.
### Key Observations
* **Color Consistency:** The four colors (green, orange, red, blue) used for the numerical vectors are consistently applied to the corresponding points in the vector space diagram. This is a critical visual link showing the direct mapping from abstract numbers to a spatial representation.
* **Abstraction Gradient:** The diagram moves from concrete (a document icon) to increasingly abstract representations (vectors, vector space) and back to a structured, human-interpretable form (knowledge graph).
* **Spatial Metaphor:** The "Vector space" component uses a 3D plot to visually communicate the concept of high-dimensional data, where distance represents similarity.
* **Process Linearity:** Both parts (a) and (b) depict strictly linear, sequential processes without feedback loops or branching paths.
### Interpretation
This diagram illustrates a foundational workflow in modern AI and natural language processing. It demonstrates how unstructured text (a document) can be systematically transformed into structured, queryable knowledge.
* **What it suggests:** The pipeline shows a method for automated knowledge extraction. The embedding model converts text into a mathematical form (vectors) that captures semantic meaning. Organizing these vectors in a space allows for the identification of relationships (similar items are close). Finally, these relationships are formalized into a knowledge graph, which is a database optimized for connecting information.
* **Relationship between elements:** Part (a) provides the philosophical framework (neuro-symbolic integration), while part (b) gives a practical implementation of one direction of that flow: from symbolic input (document) through a neuro processing stage (embedding model) to a new symbolic output (knowledge graph).
* **Notable implication:** The diagram emphasizes that the core of this transformation is the **embedding model**, which acts as the translator between human-readable text and machine-processable mathematics. The quality of the final knowledge graph is fundamentally dependent on the quality of this embedding step. The use of a simple document icon as the starting point underscores the potential to apply this process to vast corpora of text.