## Line Charts: Top-k Tokens at Head 0 and Head 1
### Overview
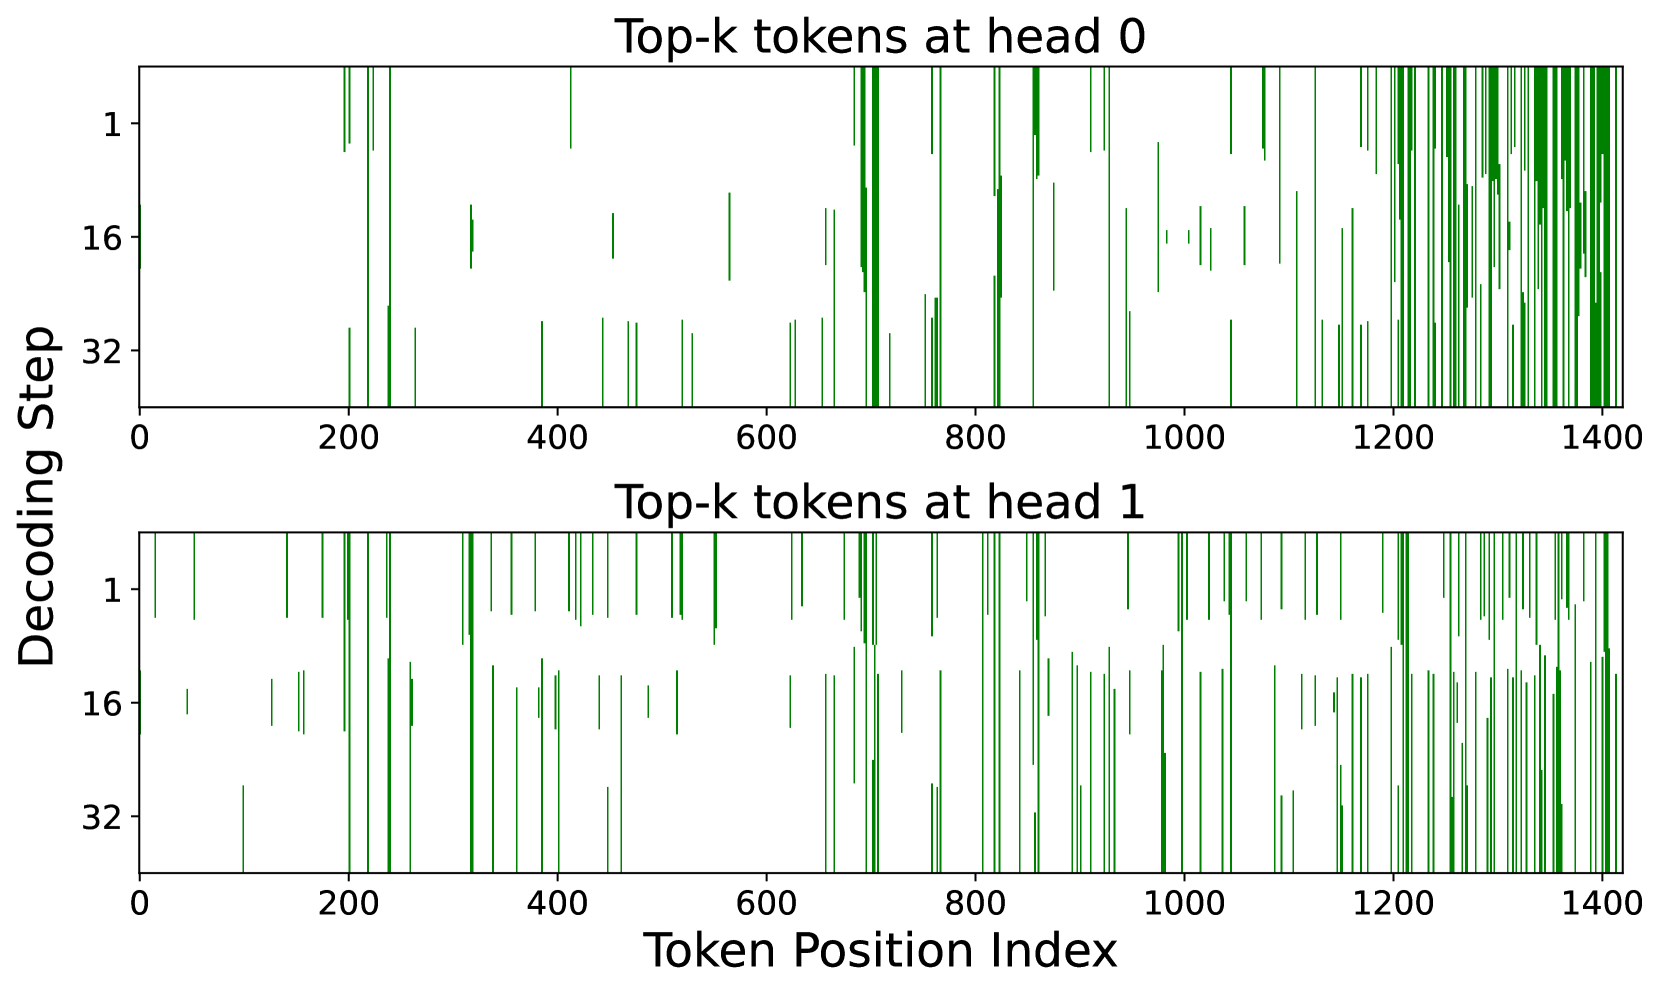
The image contains two line charts comparing the decoding steps of top-k tokens at two different attention heads (head 0 and head 1) across token positions. The charts use vertical green lines to represent decoding activity, with the x-axis showing token positions (0–1400) and the y-axis showing decoding steps (1, 16, 32).
### Components/Axes
- **X-axis**: "Token Position Index" (0–1400), labeled in increments of 200.
- **Y-axis**: "Decoding Step" (1, 16, 32), labeled in descending order.
- **Legend**: Located at the top, indicating two categories:
- "Top-k tokens at head 0" (green lines).
- "Top-k tokens at head 1" (green lines).
- **Charts**:
- **Top Chart**: Labeled "Top-k tokens at head 0".
- **Bottom Chart**: Labeled "Top-k tokens at head 1".
### Detailed Analysis
- **Top Chart (Head 0)**:
- Lines are densely clustered in the middle (token positions 400–800) and right (1000–1400) sections.
- Fewer lines appear in the left (0–200) and early middle (200–400) sections.
- Vertical lines are sharp and consistent, suggesting frequent decoding at specific positions.
- **Bottom Chart (Head 1)**:
- Lines are more spread out across all token positions, with increased density in the right section (1000–1400).
- Fewer lines in the left (0–200) and early middle (200–400) sections, but more variability than head 0.
- Lines are less uniform, indicating less consistent decoding activity.
### Key Observations
1. **Concentration vs. Spread**: Head 0 shows concentrated decoding activity, while head 1 exhibits more dispersed patterns.
2. **Right-Section Dominance**: Both charts have higher decoding activity in the right token position range (1000–1400).
3. **Vertical Line Density**: Head 0 has more vertical lines overall, suggesting more frequent decoding steps.
### Interpretation
The data suggests differences in how the model processes tokens at head 0 versus head 1. Head 0’s concentrated decoding steps may indicate stronger attention to specific tokens, while head 1’s spread-out activity could reflect broader or more variable token importance. The right-section dominance in both charts might highlight a focus on later tokens in the sequence, possibly due to contextual dependencies or model architecture design. The lack of numerical values in the image limits precise quantification, but the visual trends emphasize structural differences between the two heads.