# Technical Document Extraction: Attention Map Visualization
## 1. Image Overview
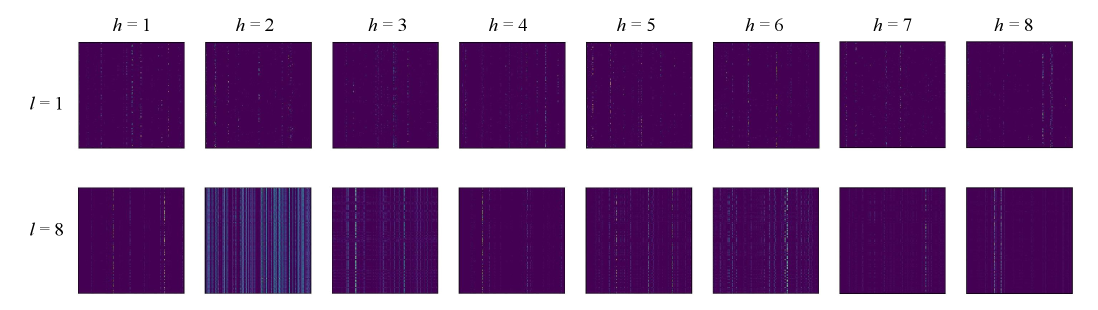
This image is a technical visualization consisting of a grid of 16 heatmaps, likely representing attention heads in a Transformer-based neural network architecture. The grid is organized into two rows and eight columns.
## 2. Component Isolation
### Header (Column Labels)
The top of the image contains labels for each column, representing different "heads" ($h$):
* **Column 1:** $h = 1$
* **Column 2:** $h = 2$
* **Column 3:** $h = 3$
* **Column 4:** $h = 4$
* **Column 5:** $h = 5$
* **Column 6:** $h = 6$
* **Column 7:** $h = 7$
* **Column 8:** $h = 8$
### Y-Axis (Row Labels)
The left side of the image contains labels for each row, representing different "layers" ($l$):
* **Row 1:** $l = 1$
* **Row 2:** $l = 8$
## 3. Data Visualization Analysis (Heatmaps)
The heatmaps use a dark purple background to represent low values (near zero) and lighter pixels (teal, green, or yellow) to represent higher activation values.
### Row 1: Layer $l = 1$
* **General Trend:** Across all heads ($h=1$ to $h=8$), the attention maps are sparse. They exhibit faint vertical striations, suggesting that at the first layer, the attention is distributed across specific tokens but remains relatively low in intensity.
* **Head-Specific Observations:**
* $h=1$ through $h=8$ show very similar patterns of sparse, vertical dotted lines.
### Row 2: Layer $l = 8$
* **General Trend:** This layer shows significantly more activation and variation compared to Layer 1. The patterns are more distinct, indicating that deeper layers have developed more specialized attention mechanisms.
* **Head-Specific Observations:**
* **$h=1$:** Sparse vertical lines, similar to Layer 1 but slightly more defined.
* **$h=2$:** **Significant Outlier.** This heatmap shows dense, bright vertical bands across the entire width. This indicates a "global" or "broad" attention pattern where the head is attending to many tokens simultaneously across the sequence.
* **$h=3$:** Shows horizontal-leaning patterns or "blocky" structures, suggesting attention to local clusters or specific segments of the sequence.
* **$h=4$ through $h=8$:** These heads return to a pattern of vertical striations, but with higher contrast and sharper "dots" of activation compared to Layer 1. $h=6$ specifically shows very sharp, bright vertical points.
## 4. Summary of Technical Information
| Parameter | Value/Range | Description |
| :--- | :--- | :--- |
| **Layers ($l$)** | 1, 8 | Represents the depth of the network being sampled. |
| **Heads ($h$)** | 1 through 8 | Represents the individual attention heads within a multi-head attention mechanism. |
| **Total Maps** | 16 | 2 layers $\times$ 8 heads. |
| **Primary Trend** | Sparsity to Complexity | Attention maps in $l=1$ are uniform and sparse; maps in $l=8$ show specialization (e.g., global attention in $h=2$, localized attention in $h=3$). |
| **Visual Encoding** | Heatmap | Dark purple = Low attention; Teal/Yellow = High attention. |
## 5. Language Declaration
The text in this image is exclusively mathematical notation and English alphanumeric characters ($h$, $l$, numbers). No other languages are present.