## Scatter Plot: Reasoning Tokens vs. Problem Size
### Overview
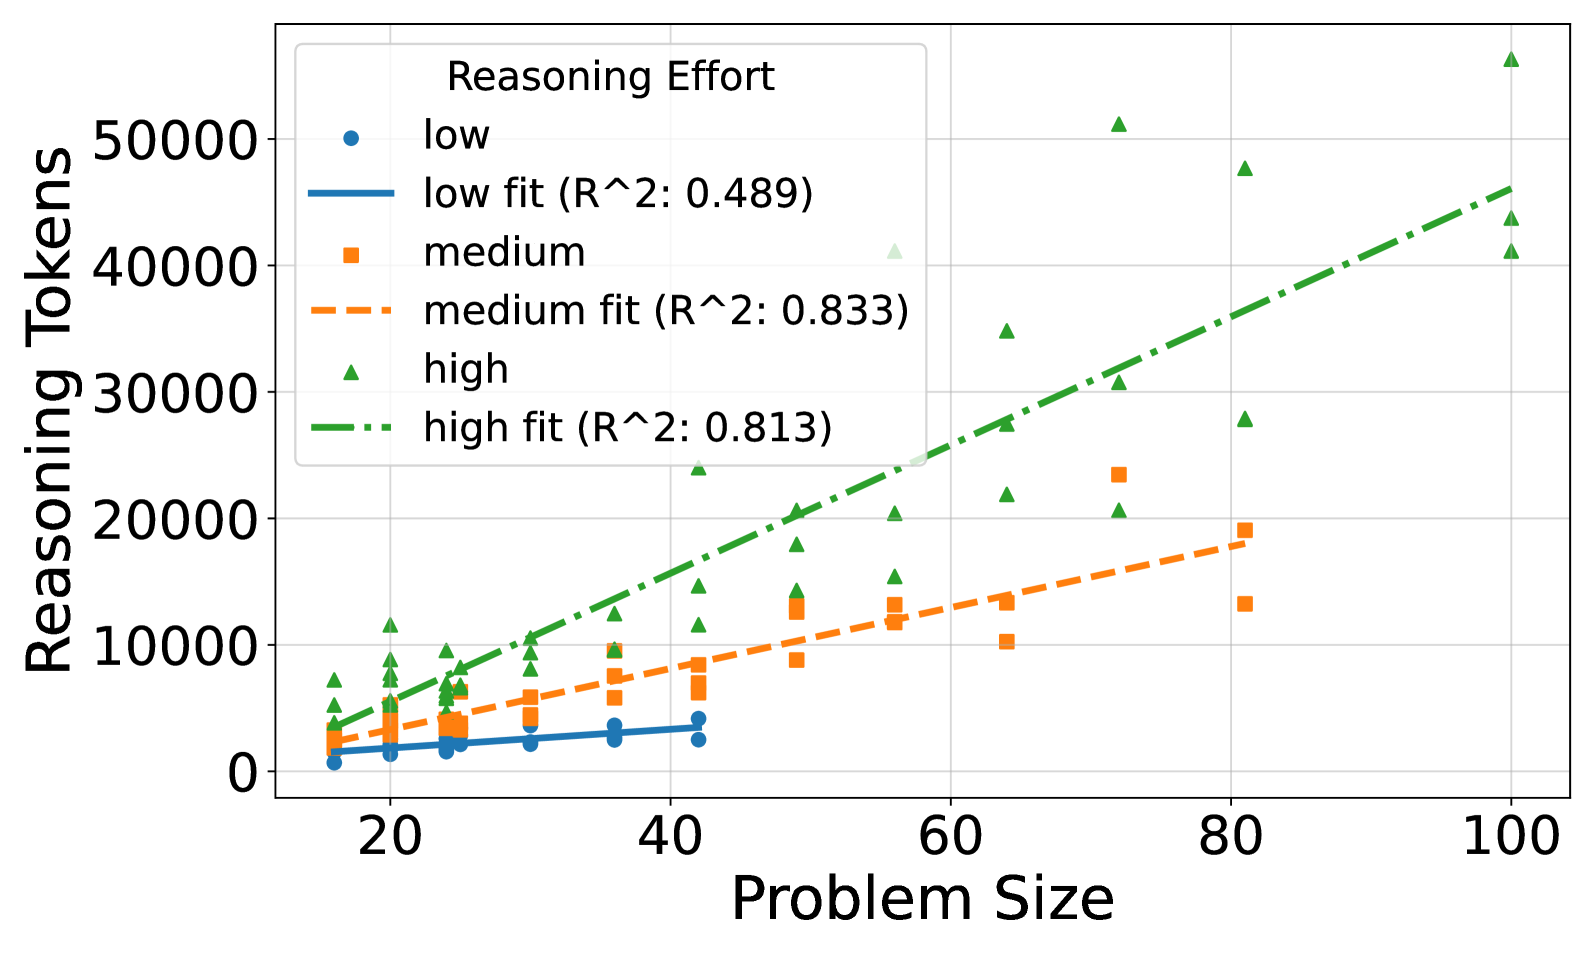
The image is a scatter plot showing the relationship between "Problem Size" and "Reasoning Tokens" for three different levels of "Reasoning Effort": low, medium, and high. Each level has a scatter plot of data points and a corresponding fitted line with an R-squared value indicating the goodness of fit.
### Components/Axes
* **X-axis:** "Problem Size", ranging from 0 to 100, with tick marks at intervals of 20.
* **Y-axis:** "Reasoning Tokens", ranging from 0 to 50000, with tick marks at intervals of 10000.
* **Legend (top-left):**
* "Reasoning Effort"
* Blue circle: "low"
* Blue solid line: "low fit (R^2: 0.489)"
* Orange square: "medium"
* Orange dashed line: "medium fit (R^2: 0.833)"
* Green triangle: "high"
* Green dash-dot line: "high fit (R^2: 0.813)"
### Detailed Analysis
* **Low Reasoning Effort (Blue):**
* Data points: Scatter points are clustered near the bottom of the chart.
* Trend: The "low fit" line is nearly flat, showing a slight positive slope.
* Data points: (20, 1000), (30, 2000), (40, 2500)
* R-squared: 0.489
* **Medium Reasoning Effort (Orange):**
* Data points: Scatter points are in the middle range of the chart.
* Trend: The "medium fit" line has a moderate positive slope.
* Data points: (20, 1000), (30, 8000), (40, 9000), (70, 22000), (80, 14000)
* R-squared: 0.833
* **High Reasoning Effort (Green):**
* Data points: Scatter points are spread across the entire range of the chart.
* Trend: The "high fit" line has a steep positive slope.
* Data points: (20, 6000), (30, 10000), (40, 12000), (50, 35000), (60, 23000), (70, 28000), (80, 50000), (90, 40000), (100, 45000)
* R-squared: 0.813
### Key Observations
* As "Problem Size" increases, "Reasoning Tokens" generally increase for all levels of "Reasoning Effort".
* The "high" reasoning effort exhibits the most significant increase in "Reasoning Tokens" as "Problem Size" increases.
* The R-squared values indicate that the fitted lines for "medium" and "high" reasoning effort are a better fit for the data than the "low" reasoning effort.
### Interpretation
The plot demonstrates that the amount of reasoning required (measured in tokens) increases with problem size. The level of reasoning effort significantly impacts the rate at which reasoning tokens increase. Problems requiring "high" reasoning effort show a much steeper increase in tokens compared to "medium" or "low" effort problems. The R-squared values suggest that a linear model is more appropriate for "medium" and "high" reasoning effort than for "low" reasoning effort, where the relationship between problem size and reasoning tokens may be more complex or less pronounced. The "low" reasoning effort shows a very weak correlation, suggesting that problem size has little impact on the number of reasoning tokens required when the reasoning effort is low.