## Line Chart: Exact Match vs. SFT Ratio
### Overview
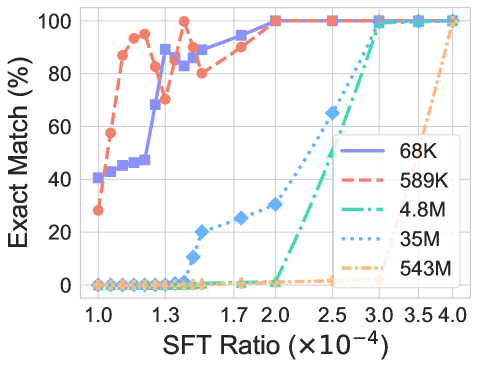
This chart displays the relationship between the SFT (Supervised Fine-Tuning) Ratio and the Exact Match percentage for several model sizes. The x-axis represents the SFT Ratio, and the y-axis represents the Exact Match percentage. Multiple lines, each representing a different model size, show how the Exact Match percentage changes as the SFT Ratio increases.
### Components/Axes
* **X-axis:** SFT Ratio (×10⁻⁴). Scale ranges from approximately 1.0 to 4.0, with markers at 1.0, 1.3, 1.7, 2.0, 2.5, 3.0, 3.5, and 4.0.
* **Y-axis:** Exact Match (%). Scale ranges from 0 to 100, with markers at 0, 20, 40, 60, 80, and 100.
* **Legend:** Located in the top-right corner, listing the model sizes:
* 68K (Purple)
* 589K (Red, dashed)
* 4.8M (Green, dashed)
* 35M (Blue, dotted)
* 543M (Orange, dotted)
### Detailed Analysis
* **68K (Purple):** The line starts at approximately 40% at an SFT Ratio of 1.0. It rises sharply to around 85% at an SFT Ratio of 1.3, plateaus around 90-95% between SFT Ratios of 1.7 and 3.0, and remains relatively stable at approximately 95% up to an SFT Ratio of 4.0.
* **589K (Red, dashed):** This line exhibits a very steep increase. Starting at approximately 5% at an SFT Ratio of 1.0, it quickly rises to a peak of around 90% at an SFT Ratio of 1.3. It then declines to approximately 80% at an SFT Ratio of 2.0, and remains relatively stable around 80-90% for higher SFT Ratios.
* **4.8M (Green, dashed):** This line starts at approximately 0% at an SFT Ratio of 1.0. It increases gradually to around 20% at an SFT Ratio of 2.0, then rises sharply to approximately 95% at an SFT Ratio of 2.5, and remains stable at around 95-100% for higher SFT Ratios.
* **35M (Blue, dotted):** This line begins at approximately 0% at an SFT Ratio of 1.0. It increases slowly to around 20% at an SFT Ratio of 2.0, then rises rapidly to approximately 98% at an SFT Ratio of 3.0, and remains stable at around 98-100% for higher SFT Ratios.
* **543M (Orange, dotted):** This line starts at approximately 0% at an SFT Ratio of 1.0. It increases gradually to around 10% at an SFT Ratio of 2.0, then rises more steeply to approximately 85% at an SFT Ratio of 3.5, and reaches approximately 95% at an SFT Ratio of 4.0.
### Key Observations
* The 68K model reaches a high Exact Match percentage relatively quickly, but plateaus early.
* The 589K model shows a rapid initial increase, followed by a decline and stabilization.
* Larger models (4.8M, 35M, and 543M) require higher SFT Ratios to achieve high Exact Match percentages, but ultimately reach similar or higher levels of performance.
* The 35M model achieves the highest Exact Match percentage, reaching nearly 100% at an SFT Ratio of 3.0.
* There is a clear positive correlation between model size and the SFT Ratio required to achieve a given Exact Match percentage.
### Interpretation
The chart demonstrates the impact of Supervised Fine-Tuning (SFT) on the performance of models of varying sizes, as measured by the Exact Match percentage. It suggests that larger models generally require more SFT to reach high levels of accuracy, but ultimately have the potential to achieve better performance. The differing curves for each model size indicate that the optimal SFT strategy may vary depending on the model's capacity. The initial rapid gains observed in some models (e.g., 589K) may be due to learning basic patterns, while the continued improvement in larger models (e.g., 35M, 543M) suggests they are capable of learning more complex relationships. The plateauing of the 68K model suggests it may have reached its capacity for improvement with SFT. The data suggests a trade-off between model size, SFT cost, and performance.