## Heatmap: LLM Performance Across Error Categories
### Overview
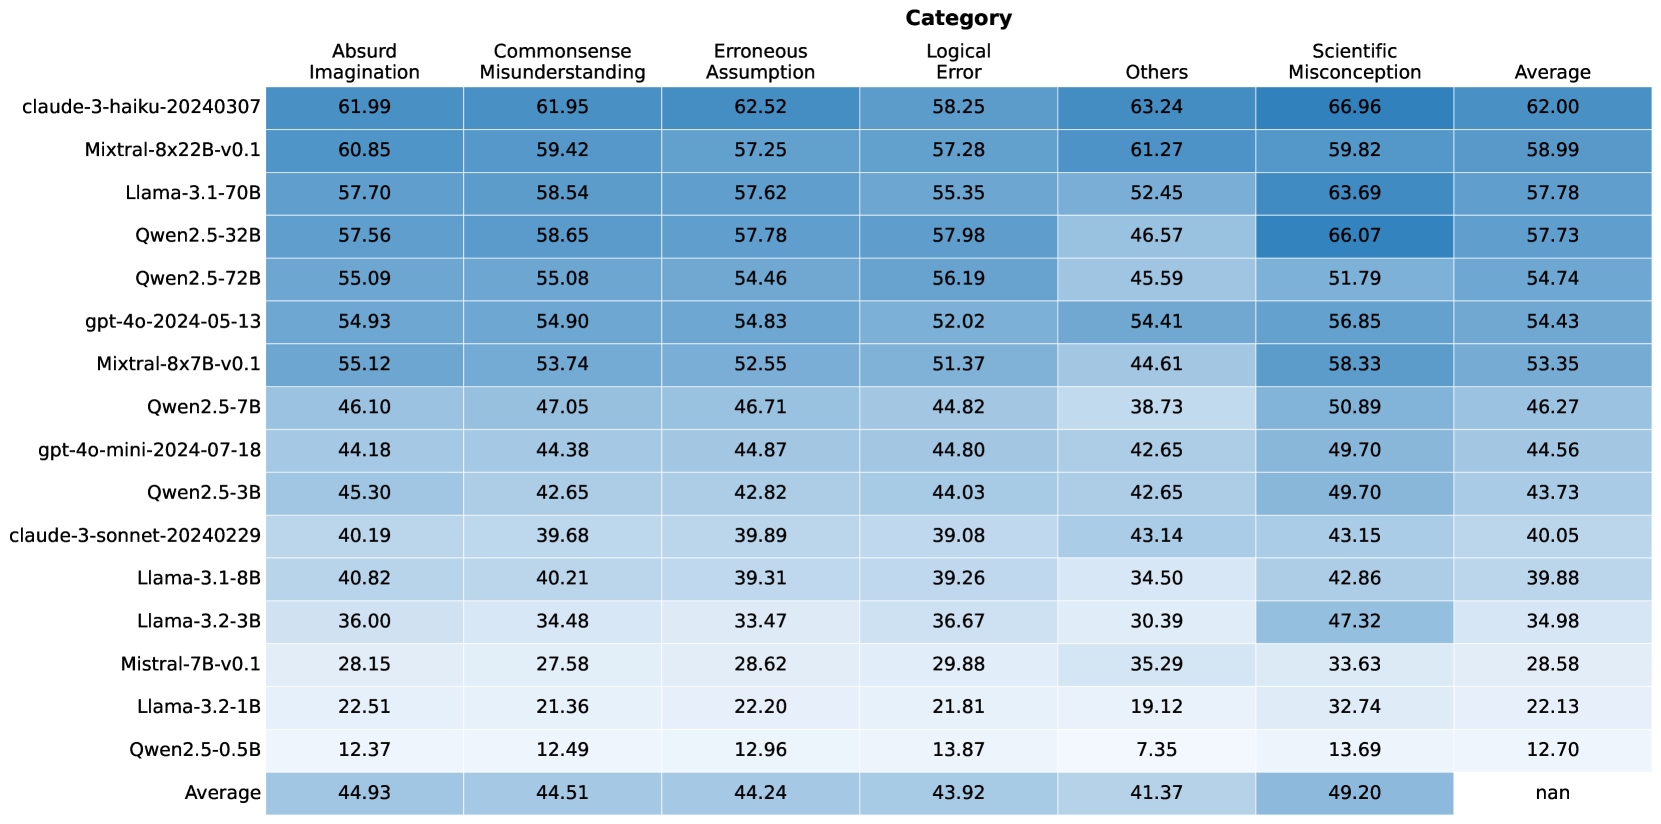
The image is a heatmap displaying the performance of various Large Language Models (LLMs) across different error categories. The rows represent the LLMs, and the columns represent the error categories and the average performance. The cells are color-coded, with darker shades indicating higher values.
### Components/Axes
* **Rows (LLMs):**
* claude-3-haiku-20240307
* Mixtral-8x22B-v0.1
* Llama-3.1-70B
* Qwen2.5-32B
* Qwen2.5-72B
* gpt-4o-2024-05-13
* Mixtral-8x7B-v0.1
* Qwen2.5-7B
* gpt-4o-mini-2024-07-18
* Qwen2.5-3B
* claude-3-sonnet-20240229
* Llama-3.1-8B
* Llama-3.2-3B
* Mistral-7B-v0.1
* Llama-3.2-1B
* Qwen2.5-0.5B
* Average
* **Columns (Categories):**
* Absurd Imagination
* Commonsense Misunderstanding
* Erroneous Assumption
* Logical Error
* Others
* Scientific Misconception
* Average
### Detailed Analysis or Content Details
The heatmap presents numerical values for each LLM's performance in each category. The values range from approximately 7.35 to 66.96. The "Average" row and column provide the average performance across LLMs and categories, respectively.
Here's a breakdown of the data, including trends and specific values:
* **Absurd Imagination:**
* Values range from 12.37 (Qwen2.5-0.5B) to 61.99 (claude-3-haiku-20240307).
* The average is 44.93.
* **Commonsense Misunderstanding:**
* Values range from 12.49 (Qwen2.5-0.5B) to 61.95 (claude-3-haiku-20240307).
* The average is 44.51.
* **Erroneous Assumption:**
* Values range from 12.96 (Qwen2.5-0.5B) to 62.52 (claude-3-haiku-20240307).
* The average is 44.24.
* **Logical Error:**
* Values range from 13.87 (Qwen2.5-0.5B) to 58.25 (claude-3-haiku-20240307).
* The average is 43.92.
* **Others:**
* Values range from 7.35 (Qwen2.5-0.5B) to 63.24 (claude-3-haiku-20240307).
* The average is 41.37.
* **Scientific Misconception:**
* Values range from 13.69 (Qwen2.5-0.5B) to 66.96 (claude-3-haiku-20240307).
* The average is 49.20.
* **Average (across categories):**
* Values range from 12.70 (Qwen2.5-0.5B) to 62.00 (claude-3-haiku-20240307).
* The average of the averages is not explicitly provided (marked as "nan").
### Key Observations
* **Top Performers:** The "claude-3-haiku-20240307" model consistently shows high values across all error categories and in the average, indicating better performance.
* **Bottom Performers:** The "Qwen2.5-0.5B" model consistently shows low values across all error categories and in the average, indicating worse performance.
* **Category Variation:** The "Scientific Misconception" category has the highest average value (49.20), suggesting that LLMs generally struggle more with this type of error. The "Others" category has the lowest average value (41.37).
### Interpretation
The heatmap provides a comparative analysis of LLM performance across different error types. The data suggests that certain models are more prone to specific types of errors than others. For example, while "claude-3-haiku-20240307" performs well overall, "Qwen2.5-0.5B" struggles across all categories. The higher average for "Scientific Misconception" indicates a general weakness in LLMs' understanding or handling of scientific concepts. This information can be valuable for developers in identifying areas for improvement in LLM training and design. The absence of an overall average ("nan") is an oversight, as it would provide a single metric for comparing the models' aggregate performance.