TECHNICAL ASSET FINGERPRINT
e98834741a721634d861991c
Click to view fullscreen
Press ESC or click to close
FOUND IN PAPERS
EXPERT: gemini-2.5-flash-lite-free VERSION 1
RUNTIME: google-free/gemini-2.5-flash-lite
INTEL_VERIFIED
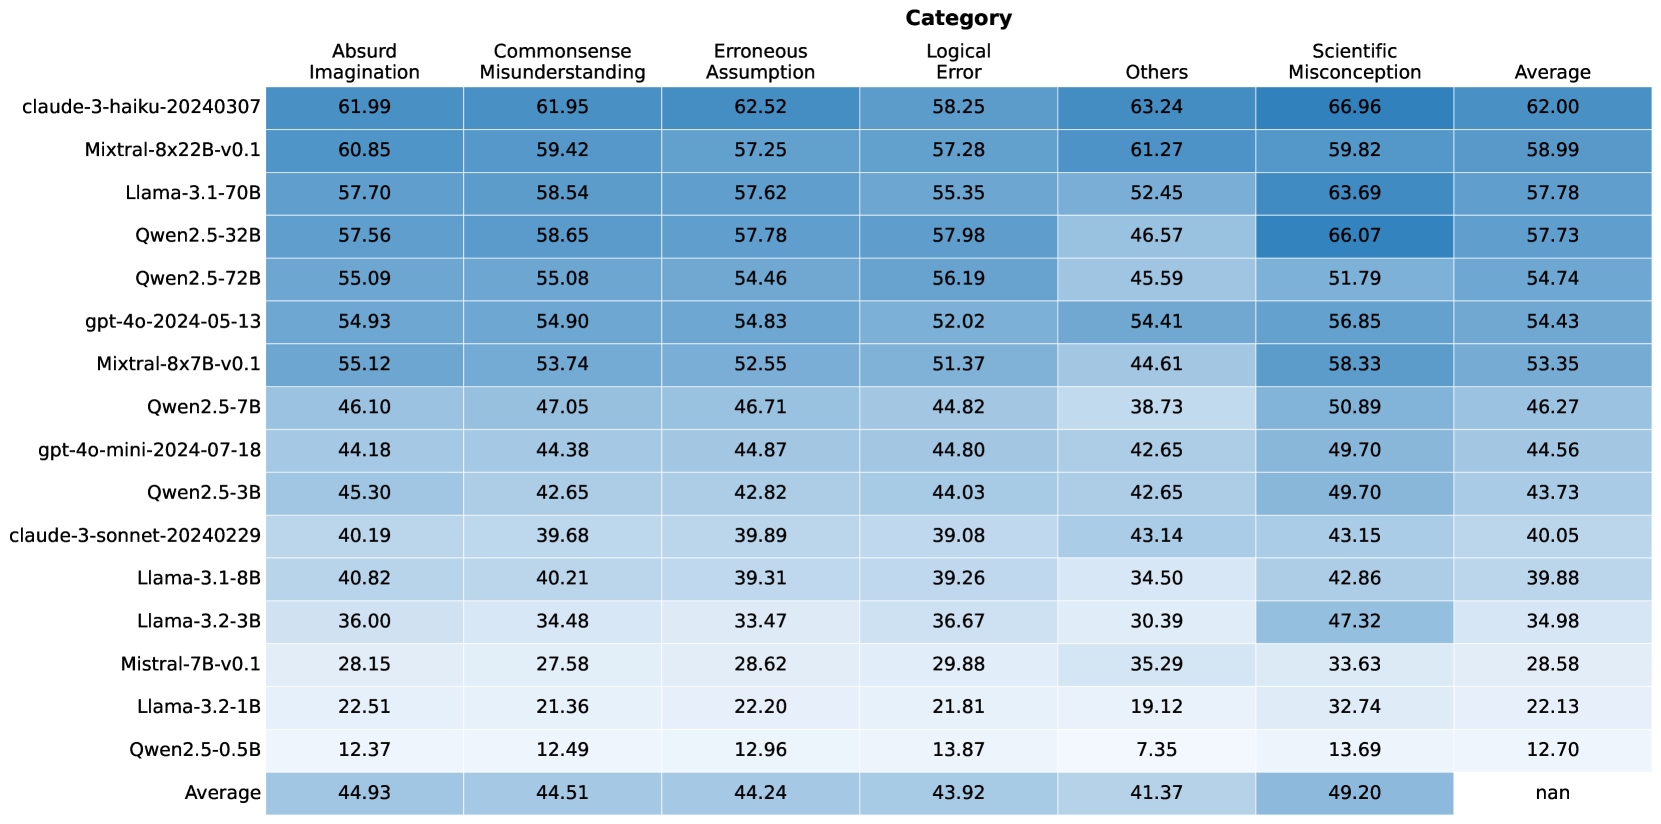
## Table: Model Performance Metrics by Category
### Overview
This image displays a table that presents performance metrics for various language models across different categories of errors or assessments. The table lists several models, each with associated numerical scores for "Absurd Imagination," "Commonsense Misunderstanding," "Erroneous Assumption," "Logical Error," "Others," and "Scientific Misconception." An "Average" row at the bottom summarizes the mean score for each category across all listed models. The data is presented with a color gradient, where darker shades of blue generally indicate higher scores.
### Components/Axes
**Row Headers (Models):**
* claude-3-haiku-20240307
* Mixtral-8x22B-v0.1
* Llama-3.1-70B
* Qwen2.5-32B
* Qwen2.5-72B
* gpt-4o-2024-05-13
* Mixtral-8x7B-v0.1
* Qwen2.5-7B
* gpt-4o-mini-2024-07-18
* Qwen2.5-3B
* claude-3-sonnet-20240229
* Llama-3.1-8B
* Llama-3.2-3B
* Mistral-7B-v0.1
* Llama-3.2-1B
* Qwen2.5-0.5B
* Average
**Column Headers (Categories):**
* Absurd Imagination
* Commonsense Misunderstanding
* Erroneous Assumption
* Logical Error
* Others
* Scientific Misconception
* Average
**Data Cells:** Numerical values representing scores for each model within each category.
### Content Details
The table contains the following data points:
| Model Name | Absurd Imagination | Commonsense Misunderstanding | Erroneous Assumption | Logical Error | Others | Scientific Misconception | Average |
| :----------------------------- | :----------------- | :--------------------------- | :------------------- | :------------ | :----- | :----------------------- | :------ |
| claude-3-haiku-20240307 | 61.99 | 61.95 | 62.52 | 58.25 | 63.24 | 66.96 | 62.00 |
| Mixtral-8x22B-v0.1 | 60.85 | 59.42 | 57.25 | 57.28 | 61.27 | 59.82 | 58.99 |
| Llama-3.1-70B | 57.70 | 58.54 | 57.62 | 55.35 | 52.45 | 63.69 | 57.78 |
| Qwen2.5-32B | 57.56 | 58.65 | 57.78 | 57.98 | 46.57 | 66.07 | 57.73 |
| Qwen2.5-72B | 55.09 | 55.08 | 54.46 | 56.19 | 45.59 | 51.79 | 54.74 |
| gpt-4o-2024-05-13 | 54.93 | 54.90 | 54.83 | 52.02 | 54.41 | 56.85 | 54.43 |
| Mixtral-8x7B-v0.1 | 55.12 | 53.74 | 52.55 | 51.37 | 44.61 | 58.33 | 53.35 |
| Qwen2.5-7B | 46.10 | 47.05 | 46.71 | 44.82 | 38.73 | 50.89 | 46.27 |
| gpt-4o-mini-2024-07-18 | 44.18 | 44.38 | 44.87 | 44.80 | 42.65 | 49.70 | 44.56 |
| Qwen2.5-3B | 45.30 | 42.65 | 42.82 | 44.03 | 42.65 | 49.70 | 43.73 |
| claude-3-sonnet-20240229 | 40.19 | 39.68 | 39.89 | 39.08 | 43.14 | 43.15 | 40.05 |
| Llama-3.1-8B | 40.82 | 40.21 | 39.31 | 39.26 | 34.50 | 42.86 | 39.88 |
| Llama-3.2-3B | 36.00 | 34.48 | 33.47 | 36.67 | 30.39 | 47.32 | 34.98 |
| Mistral-7B-v0.1 | 28.15 | 27.58 | 28.62 | 29.88 | 35.29 | 33.63 | 28.58 |
| Llama-3.2-1B | 22.51 | 21.36 | 22.20 | 21.81 | 19.12 | 32.74 | 22.13 |
| Qwen2.5-0.5B | 12.37 | 12.49 | 12.96 | 13.87 | 7.35 | 13.69 | 12.70 |
| **Average** | **44.93** | **44.51** | **44.24** | **43.92** | **41.37** | **49.20** | **nan** |
**Note:** The "Average" column for the "Average" row is marked as "nan" (not a number), which is expected as it would be the average of averages.
### Key Observations
* **Top Performers:** `claude-3-haiku-20240307` and `Mixtral-8x22B-v0.1` generally exhibit the highest scores across most categories, particularly in "Absurd Imagination," "Commonsense Misunderstanding," "Erroneous Assumption," and "Others."
* **Scientific Misconception:** This category shows the highest scores overall for many models, with `claude-3-haiku-20240307` (66.96) and `Qwen2.5-32B` (66.07) scoring particularly high. This suggests that models might be more prone to exhibiting scientific misconceptions or that the metric for this category is designed to capture a different aspect of performance.
* **Lowest Performers:** `Qwen2.5-0.5B` consistently has the lowest scores across all categories, indicating it is the least capable model among those tested. `Llama-3.2-1B` and `Mistral-7B-v0.1` also show very low scores.
* **Category Trends:**
* "Scientific Misconception" generally has higher scores than other categories for most models.
* "Others" tends to have lower scores for many models, especially for the smaller or less capable ones.
* "Absurd Imagination," "Commonsense Misunderstanding," and "Erroneous Assumption" show a similar range of scores for many models.
* "Logical Error" scores are generally in the mid-range.
* **Average Scores:** The overall average scores across all models are highest for "Absurd Imagination" (44.93) and "Scientific Misconception" (49.20), and lowest for "Others" (41.37).
### Interpretation
This table provides a quantitative assessment of different language models' performance across various dimensions, likely related to their ability to generate coherent, accurate, and contextually appropriate text. The categories suggest an evaluation of how well models avoid common pitfalls in reasoning and knowledge.
* **Model Capabilities:** The stark differences in scores, especially between models like `claude-3-haiku-20240307` and `Qwen2.5-0.5B`, highlight significant variations in the capabilities of these language models. Larger or more advanced models appear to perform better overall.
* **Nature of Metrics:** The high scores in "Scientific Misconception" are particularly interesting. This could imply that the models are more likely to generate text that aligns with common, albeit incorrect, scientific beliefs, or that the metric is designed to identify instances where models might confidently present flawed scientific information. Conversely, it could mean that models are adept at *identifying* scientific misconceptions if that's how the metric is framed, but the context of "performance metrics" suggests the former.
* **"Others" Category:** The consistently lower scores in the "Others" category for many models might indicate that this category captures a more nuanced or difficult aspect of performance, or that it represents a broader set of less common errors.
* **Overall Performance:** The average scores suggest that, as a group, these models are relatively strong in avoiding "Absurd Imagination" and "Commonsense Misunderstanding" but show more variability or weakness in "Scientific Misconception" and "Others." The "Average" column for each model provides a single composite score, but the breakdown by category offers a more granular understanding of where each model excels or struggles. The "nan" in the average of averages is a standard data representation for an undefined or uncalculable average.
DECODING INTELLIGENCE...