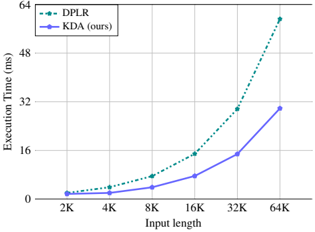
## Chart: Execution Time vs. Input Length
### Overview
The image is a line chart comparing the execution time (in milliseconds) of two algorithms, DPLR and KDA (ours), as a function of input length. The x-axis represents the input length, ranging from 2K to 64K. The y-axis represents the execution time, ranging from 0 to 64 ms.
### Components/Axes
* **X-axis:** Input length, labeled "Input length". Values: 2K, 4K, 8K, 16K, 32K, 64K.
* **Y-axis:** Execution Time (ms), labeled "Execution Time (ms)". Values: 0, 16, 32, 48, 64.
* **Legend:** Located at the top-left of the chart.
* DPLR: Represented by a dashed green line.
* KDA (ours): Represented by a solid blue line.
### Detailed Analysis
* **DPLR (dashed green line):** The execution time increases rapidly with input length.
* 2K: Approximately 0.8 ms
* 4K: Approximately 1.6 ms
* 8K: Approximately 4 ms
* 16K: Approximately 15 ms
* 32K: Approximately 30 ms
* 64K: Approximately 60 ms
* **KDA (ours) (solid blue line):** The execution time increases with input length, but at a slower rate than DPLR.
* 2K: Approximately 0.8 ms
* 4K: Approximately 0.9 ms
* 8K: Approximately 2 ms
* 16K: Approximately 5 ms
* 32K: Approximately 15 ms
* 64K: Approximately 30 ms
### Key Observations
* Both algorithms show an increase in execution time as the input length increases.
* KDA (ours) consistently outperforms DPLR, exhibiting significantly lower execution times for all input lengths.
* The difference in execution time between the two algorithms becomes more pronounced as the input length increases.
### Interpretation
The chart demonstrates that the KDA (ours) algorithm is more efficient than the DPLR algorithm in terms of execution time, especially for larger input lengths. This suggests that KDA (ours) is a better choice for applications where processing speed is critical, particularly when dealing with large datasets. The trend indicates that the performance gap between the two algorithms would likely widen further with even larger input sizes.