## Line Chart: Loss Value vs. Epoch Across Four Tasks
### Overview
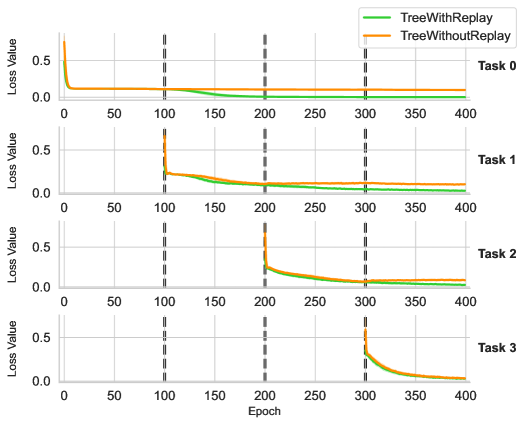
The image displays four line charts (Task 0–Task 3) comparing the loss values of two models, **TreeWithReplay** (green) and **TreeWithoutReplay** (orange), over 400 epochs. Each task shows distinct convergence patterns, with vertical dashed lines marking epochs 100, 200, 300, and 400.
---
### Components/Axes
- **X-axis**: Epoch (0–400, increments of 50).
- **Y-axis**: Loss Value (0–0.5, increments of 0.1).
- **Legend**:
- Green: TreeWithReplay
- Orange: TreeWithoutReplay
- **Task Labels**: Positioned at the top-right of each subplot (Task 0–Task 3).
---
### Detailed Analysis
#### Task 0
- **TreeWithReplay (Green)**:
- Starts at ~0.5 loss, drops sharply to near 0 by epoch 50, and remains stable.
- **TreeWithoutReplay (Orange)**:
- Starts at ~0.5 loss, declines gradually to near 0 by epoch 100, then stabilizes.
#### Task 1
- **TreeWithReplay (Green)**:
- Drops rapidly to near 0 by epoch 50, maintaining stability.
- **TreeWithoutReplay (Orange)**:
- Starts at ~0.5 loss, spikes to ~0.5 at epoch 100, then declines to near 0 by epoch 200.
#### Task 2
- **TreeWithReplay (Green)**:
- Drops sharply to near 0 by epoch 50, remaining stable.
- **TreeWithoutReplay (Orange)**:
- Declines gradually from ~0.5 to near 0 by epoch 200.
#### Task 3
- **TreeWithReplay (Green)**:
- Drops rapidly to near 0 by epoch 50, stable thereafter.
- **TreeWithoutReplay (Orange)**:
- Starts at ~0.5 loss, spikes to ~0.5 at epoch 300, then declines to near 0 by epoch 400.
---
### Key Observations
1. **Consistent Performance of TreeWithReplay**:
- Across all tasks, TreeWithReplay achieves near-zero loss by epoch 50–100 and remains stable.
2. **Instability in TreeWithoutReplay**:
- Tasks 1 and 3 show abrupt loss spikes (~0.5) at epochs 100 and 300, respectively, before recovery.
3. **Slower Convergence for TreeWithoutReplay**:
- In Tasks 0, 2, and 3, TreeWithoutReplay takes 100–200 epochs to reach near-zero loss compared to TreeWithReplay’s 50–100 epochs.
---
### Interpretation
- **Impact of Replay Mechanism**:
- TreeWithReplay demonstrates faster and more stable convergence, suggesting the replay mechanism mitigates catastrophic forgetting or instability during training.
- **Spike Analysis**:
- The spikes in TreeWithoutReplay (Tasks 1 and 3) may indicate temporary destabilization when learning new tasks without retaining prior knowledge. This aligns with known challenges in continual learning, where models without replay often forget earlier tasks.
- **Practical Implications**:
- The results highlight the importance of replay mechanisms for maintaining performance across sequential tasks, particularly in dynamic or multi-task learning environments.
---
### Spatial Grounding & Verification
- **Legend Position**: Top-right corner, clearly associating colors with model names.
- **Axis Labels**: Y-axis labeled "Loss Value," X-axis labeled "Epoch," with consistent scaling across all subplots.
- **Data Series Alignment**: Green (TreeWithReplay) and orange (TreeWithoutReplay) lines match legend labels in all tasks.
---
### Content Details
- **Task 0**:
- TreeWithReplay: 0.5 → 0 (epoch 0–50).
- TreeWithoutReplay: 0.5 → 0 (epoch 0–100).
- **Task 1**:
- TreeWithReplay: 0.5 → 0 (epoch 0–50).
- TreeWithoutReplay: 0.5 → 0.5 (spike at epoch 100) → 0 (epoch 100–200).
- **Task 2**:
- TreeWithReplay: 0.5 → 0 (epoch 0–50).
- TreeWithoutReplay: 0.5 → 0 (epoch 0–200).
- **Task 3**:
- TreeWithReplay: 0.5 → 0 (epoch 0–50).
- TreeWithoutReplay: 0.5 → 0.5 (spike at epoch 300) → 0 (epoch 300–400).
---
### Final Notes
The chart underscores the efficacy of replay mechanisms in stabilizing training dynamics. The spikes in TreeWithoutReplay suggest potential overfitting or instability when tasks are introduced sequentially without memory retention. Further investigation into the spike causes (e.g., data distribution shifts, hyperparameter sensitivity) could refine model robustness.